Logs and diagnostics
When something does not work, SiteManager gives you several places to look, and one thing to send to MultiTaction support. This page says where each one is, what is in it and when to use it.
- The service log says what the service itself did and why it could not do something.
- The diagnostics bundle is one download for support. It holds the state of your displays and of the service.
- The audit log says who changed what.
- The status history shows how each display behaved over time.
- Each display page and the Capabilities page show what SiteManager knows about one display.
For a list of messages and their fixes, see Troubleshooting.
The service log
The service writes a log of its own. It records start-up, the mode and address it listens on, and warnings and errors.
The log goes to two places:
- a file named
sitemanagerd.login the state directory; - standard error. Under systemd on Linux, that is the journal. When you start
sitemanagerdyourself, for example on macOS, it is the terminal window.
Where the file is
- Windows:
C:\ProgramData\MultiTaction\SiteManager\sitemanagerd.log. The folder can be read only by SYSTEM and Administrators, so open the file from an administrator program, such as Notepad started with Run as administrator. In PowerShell, started as administrator,Get-Content "C:\ProgramData\MultiTaction\SiteManager\sitemanagerd.log" -Tail 50 -Waitfollows it. A failure to start the service is also written to the Windows Application event log, under the sourceSiteManager. Open Event Viewer and look in Windows Logs › Application. - Linux:
/var/lib/sitemanager/sitemanagerd.log, readable byrootonly. Follow it withsudo tail -f /var/lib/sitemanager/sitemanagerd.log. The same lines are in the journal:sudo journalctl -u sitemanagerd -f. Add-n 200 --no-pagerfor the last 200 lines. - macOS: there is no installer and no service, so the log is
sitemanagerd.login the folder you gave with--state-dir(for example~/sitemanager-state), and the output in the Terminal window that runssitemanagerd. If you did not give--state-dir, it is in a folder namedsitemanager-statein the folder you started the service from.
To keep the log somewhere else, start the service with --log-file PATH. The file must not be one of the other files in the state directory, and SiteManager refuses a path that would overwrite one. On Linux, add the option to SITEMANAGER_ARGS in /etc/default/sitemanager and restart the service. On Windows, see changing the service. If the file cannot be opened, the service still runs and logs to standard error only, and says why.
What it looks like
The file holds one JSON object per line, with the time, the level (INFO, WARN or ERROR), a message and some extra fields. For example:
{"time":"2026-10-13T21:55:15.024+02:00","level":"INFO","msg":"sitemanagerd listening","mode":"local","url":"http://127.0.0.1:8790/","version":"26.10.1"}
The standard-error copy is the same information as plain text, one line per event. A line you will read often is the first one that follows a restart: it names the mode and the address.
The log rotates by size. When sitemanagerd.log reaches 4 MiB, SiteManager renames it sitemanagerd.log.1, and the older copy becomes sitemanagerd.log.2. Two older files are kept, so the log normally takes no more than about 12 MiB. The file is created so that only the account that runs the service can read it.
Credentials are never written to the log. A field whose name looks like a secret is written as <hidden>, and a user name and password inside a web address are cut out. The standard-error copy is not filtered in the same way: the first-run setup token appears there in network mode, so that you can read it in the journal.
Can I get more detail?
No. This version has no log-level option, no environment variable and no setting that makes the service log more. The service logs at its one fixed level. When you need more than the log tells you, take a diagnostics bundle. It holds the service log and what the displays report. Support can read it without anything else from you.
The diagnostics bundle
The bundle is the one thing to attach when you contact MultiTaction support. It collects what support needs from the displays and from the service, in one download.
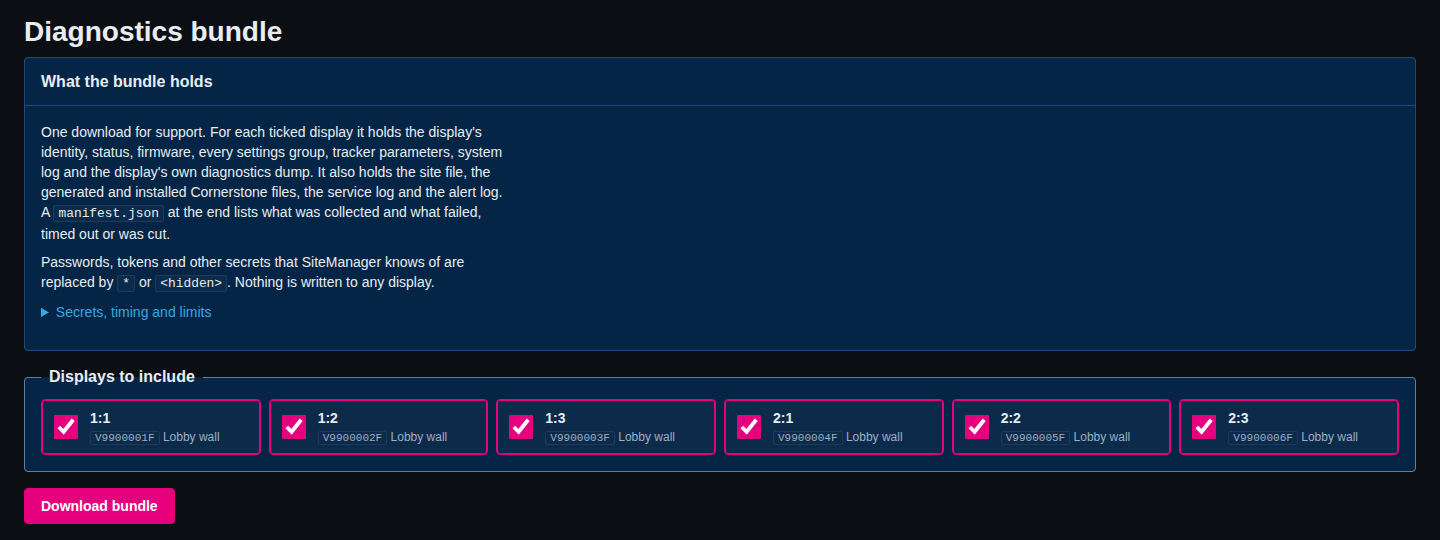
Take a bundle
- Open Diagnostics in the menu (the Monitor group).
- The page lists your displays, each ticked. Untick displays you do not need. A display that has no SiteManager interface is greyed out and listed as skipped.
- Under Files from this computer, tick the products support asked about. None is ticked at first. See Files from this computer.
- Select Download bundle. Your browser downloads a zip file named
sitemanager-diagnostics-<site name>-<UTC time>.zip. The download starts when the first data is ready. - Wait. A single display usually takes less than a minute. Displays are read four at a time. A very large site of 64 displays can take about 40 minutes. A second bundle cannot start until the first has finished.
Any user can take a bundle, including a viewer, so a customer's staff can attach one to a support case. Only an administrator can add crash dumps to it. The request is written to the audit log as Diagnostics bundle, before the download starts.
From the command line:
sitemanager diagnostics --out bundle.zip
sitemanager diagnostics --displays V9900001F,V9900002F
sitemanager diagnostics --include canvus,launcher --out bundle.zip
The command prints a summary when it is done, for example 6 displays, 120 items: 117 ok, 3 skipped; 7 secret values masked., and lists each item it skipped. Exit code 0 means everything was collected. See Command reference.
What is in the bundle
This is a bundle taken from a site with one wall of six displays, opened as a zip file. Yours has the same layout with your serial numbers.
For each display there is a folder displays/<serial>/ with:
info.json: the serial number, model, host name, firmware version and revision, and MAC address;status.json: the state SiteManager read, with temperature and frame rates;firmware.json: the firmware version;unsaved.json: whether the display holds settings that are not saved;capabilities.json: what its interface advertises;settings/: one file for each group of settings (network.json,osd.json,picture.json,remote-control.json,ssh.json,standby.json,syslog.json,tuio.jsonandvideo.json);tracker/schema.jsonandtracker/params.json: the tracker parameters and their definitions;syslog.txt: the display's own system log;diagnostics.gz: the display's own diagnostics dump, made by the display;errors.txt: what could not be read from this display and why (only when something failed).
From the service, in a service/ folder:
site.json: the site: displays, walls, rooms, profiles and host settings;generated/screen.xml,generated/config.txtandgenerated/mt-canvus.ini: the Cornerstone files SiteManager would write now (a file is missing when the layout has errors or nothing is placed; the manifest says why);on-disk/screen.xml,on-disk/config.txtandon-disk/mt-canvus.ini: the same three files as they are on this computer now;sitemanagerd.log: the service log;alerts.logandalerts-active.json: the alert log and the alerts that are open;polling.json: how often each display is read and when it was last seen;version.txt: the SiteManager version.
At the top level, manifest.json says when the bundle was made, by which user, which displays it covers, and the limits that applied. It lists every item with its status, size and time taken. The status is ok, truncated, failed, timeout or skipped. Read it first: a file that is missing from a display's folder is explained there. It also tells you how many secret values SiteManager masked.
Files from this computer (optional)
Support often needs more than the displays can tell: the Canvus configuration, the logs of Canvus, Showcase or the launcher, or a crash dump. The boxes under Files from this computer add them. Nothing is added unless you tick it. SiteManager only reads these files from the computer it runs on. It never changes them.
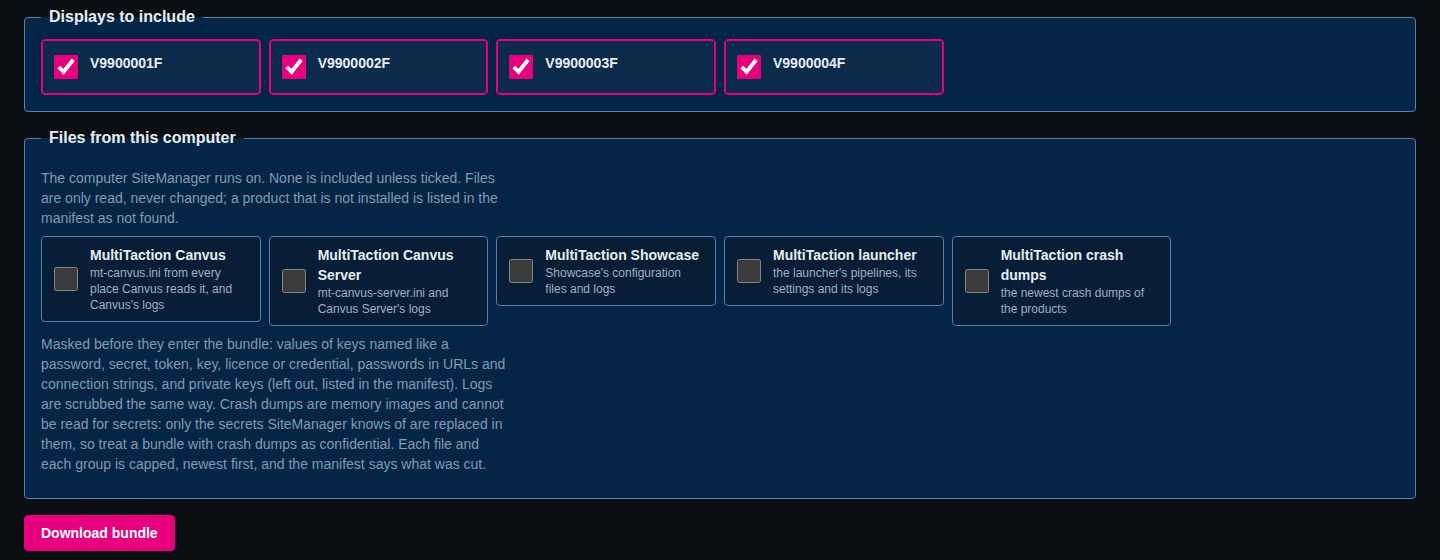
Each box adds one folder to the zip, computer/<category>/. With the command line, --include takes the same names, separated by commas, or all.
- MultiTaction Canvus (
canvus):computer/canvus/user-config/mt-canvus.ini,computer/canvus/system-config/mt-canvus.ini,computer/canvus/cornerstone-user/andcomputer/canvus/cornerstone-system/(audio-config.xml,audio-devices.xml, and in the system folderconfig.txtandscreen.xml),computer/canvus/logs/(Canvus's own logs) andcomputer/canvus/pipeline-logs/mt-canvus-<version>/(the launcher's Canvus logs). - MultiTaction Canvus Server (
canvus-server):computer/canvus-server/system-config/mt-canvus-server.ini,computer/canvus-server/env-config/<file>(only when the service has theMT_CANVUS_SERVER_CONFIGsetting),computer/canvus-server/logs/mt-canvus-server-*.log, and on Windowscomputer/canvus-server/installer-log/installer.logandcomputer/canvus-server/logs-default/. - MultiTaction Showcase (
showcase):computer/showcase/with, depending on the system,operator-config/andpackaged-config/<folder>/(Linux),install-server/(Windows) orapp-server/<app>/andapp-player/<app>/(macOS); and on every systemlogs/,player-cache/mt-showcase-cache.ini,player-logs/andpipeline-logs/mt-showcase-<version>/. - MultiTaction launcher (
launcher):computer/launcher/user-config/launcher.ini,computer/launcher/system-config/launcher.ini,computer/launcher/user-pipelines/,computer/launcher/system-pipelines/,computer/launcher/logs/andcomputer/launcher/pipeline-logs/<name>/. - MultiTaction crash dumps (
crash-dumps): the newest*.dmpfiles, incomputer/crash-dumps/breakpad/andbreakpad-canvus-server/(Linux) orcrashpad/,windows-error-reporting/and their two-system-accountfolders (Windows). macOS has none.
The reference page lists every file of each folder and the place on the computer it is read from, for Linux, macOS and Windows: Files from this computer.
If a product is not installed, the bundle holds no folder for it. manifest.json has one skipped line, computer/<category>/, whose note starts with not found and lists the places SiteManager looked. A folder or file SiteManager is not allowed to read is a skipped line too, with the note no permission to read and the path. That is not an error: the bundle is still complete and the command still exits with 0. If a product's files are somewhere else, tell support. The source in each line of the manifest shows where each file was read from.
Crash dumps need an administrator. A crash dump is a copy of a program's memory, so no program can clean it of passwords. The box is greyed out for a viewer, with the reason. In local mode everyone is an administrator. SiteManager keeps the newest 5 dumps, skips one over 64 MiB, and stops at 256 MiB for all.
Secrets in these files. In the configuration files and logs, SiteManager replaces passwords, tokens, keys, web-address passwords and webhook paths with <hidden>, and leaves private key files out (the manifest says left out: private key). That cannot be done for a crash dump, so a bundle with crash dumps is confidential. See Passwords and other secrets for the full rule.
Size. A configuration file over 1 MiB is skipped. A log keeps its last 8 MiB, and at most 40 logs and 32 MiB are kept for each product, newest first. The manifest says what was cut.
The audit log is not in the bundle. If support asks for it, see The audit log.
What it never contains
SiteManager only reads from the displays to make a bundle. It never writes anything to a display.
It replaces every secret it knows of with * characters of the same length (in the files from this computer, with <hidden>), and masks every value under a key whose name looks like a secret. This applies to settings, configuration files, logs, and the inside of the display's own diagnostics dump. That covers passwords, tokens, proxy passwords, and the credentials of alert channels and profiles. A viewer's bundle is masked the same way.
The display's own dump comes from the display, and crash dumps from this computer are memory images. Either can hold a secret that SiteManager does not know about, so treat a bundle as confidential and send it only to MultiTaction support.
Send it to MultiTaction support
Display access keys are never in a bundle. Attach the zip file to your support case with MultiTaction, together with a short description: what you did, what you expected and what happened instead, and the time it happened. Do not unzip and edit it. A bundle from a large site can be too big for email, because each display's dump can be up to 256 MiB. If it is, ask your support contact how to send it.
Look at one display
A display page does not have a log or a download of its own. It shows what SiteManager knows:
- the tile, with the state, temperature and frame rate, and any alert;
- Details has Identity (serial number, model and the firmware version at the last discovery) and Capabilities;
- the History tab shows charts of the display's temperature, power, frame rates, tracker restarts and how often it was online;
- Identify shows the display's name, or a text you type, on its screens for a few seconds, so you can find the physical display.
The display's own system log and diagnostics dump reach you only through the diagnostics bundle.
The audit log
The Audit page, in the Monitor group, lists the 200 most recent changes, newest first: the time, the user, the action, the displays involved, and a Technical detail disclosure with the values before and after.
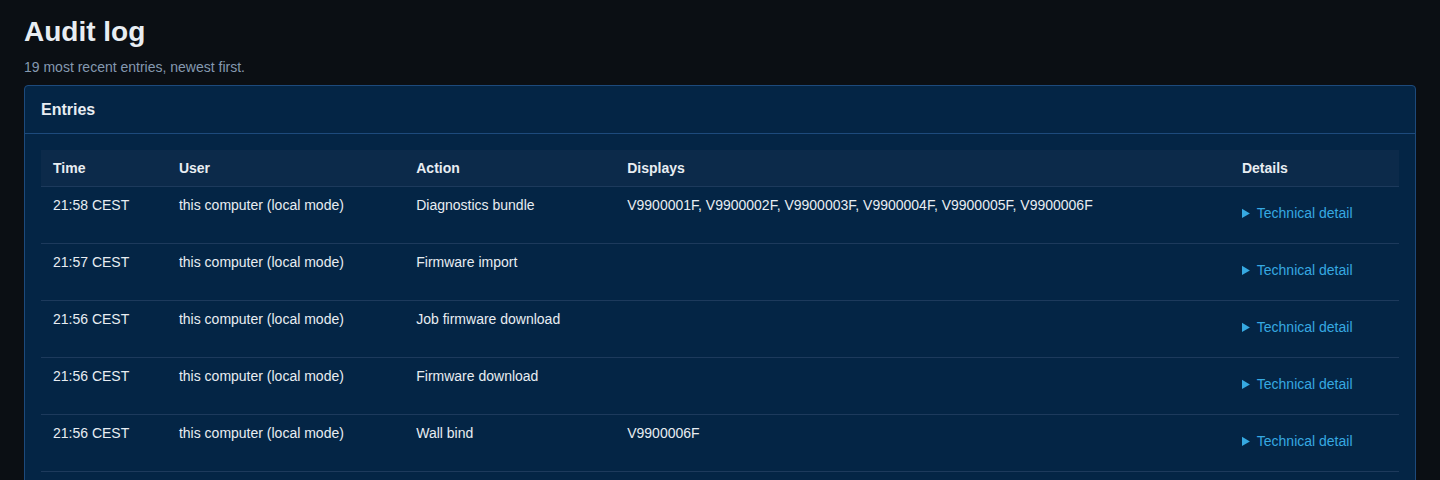
SiteManager writes an entry for every change: adding displays, walls and planned displays, firmware downloads and imports, jobs, settings, files written, alert changes and sign-ins. It also records a few actions that change nothing, such as taking a diagnostics bundle. In local mode the user is shown as this computer (local mode). In network mode it is the name of the person.
The complete log is the file audit.log in the state directory. It starts a new file at 10 MiB and keeps five. Secrets never appear in it. Only administrators can open the Audit page. See Users, roles and security.
Changes made with the command line in direct mode do not go through the service, and are not in its audit log.
Status history
SiteManager records each display's temperature, power, frame rates, tracker restarts and how often it answered. Use the History tab of a display, or History… on a wall page, to see how a problem developed. A gap in a line is time with no reading. Detail is kept at 30 seconds for 24 hours, at 5 minutes for 30 days and at 1 hour for a year. See Monitoring and history.
The Capabilities page
The Capabilities page, reached from the link at the bottom of the overview and from Details on a display page, shows what each display's firmware says its interface can do. For each display it shows one of four states: none (the display answered and advertises nothing, which is not a problem), advertised (with the list), unknown (SiteManager could not tell, with the reason) or not probed (no answer yet). Use it when a feature seems to be missing on one display, and include it in your description to support. See Diagnostics and capabilities.
Which one do I use?
- A page does not open, or the service will not start: the service log, then the journal or event log.
- A display shows offline, or a feature behaves oddly on one display: the display page, the Capabilities page and History, then a bundle for support.
- Someone asks who changed a setting: the audit log.
- Support asks for logs: a bundle from the Diagnostics page.