Day-to-day: looking after a working site
When the walls and rooms are set up, SiteManager mostly watches. This page shows what to look at each day, how to get told when something is wrong, how to keep settings the same across displays, how to change a setting on several displays at once, and how to follow a long job.
Each section ends with a link to the reference page that has every field. The examples use a site with two walls, Lobby wall (four displays) and Boardroom (two displays).
Watch the site
The overview and the health line
Open Overview. The strip at the top is the health line. It answers one question: is everything fine?
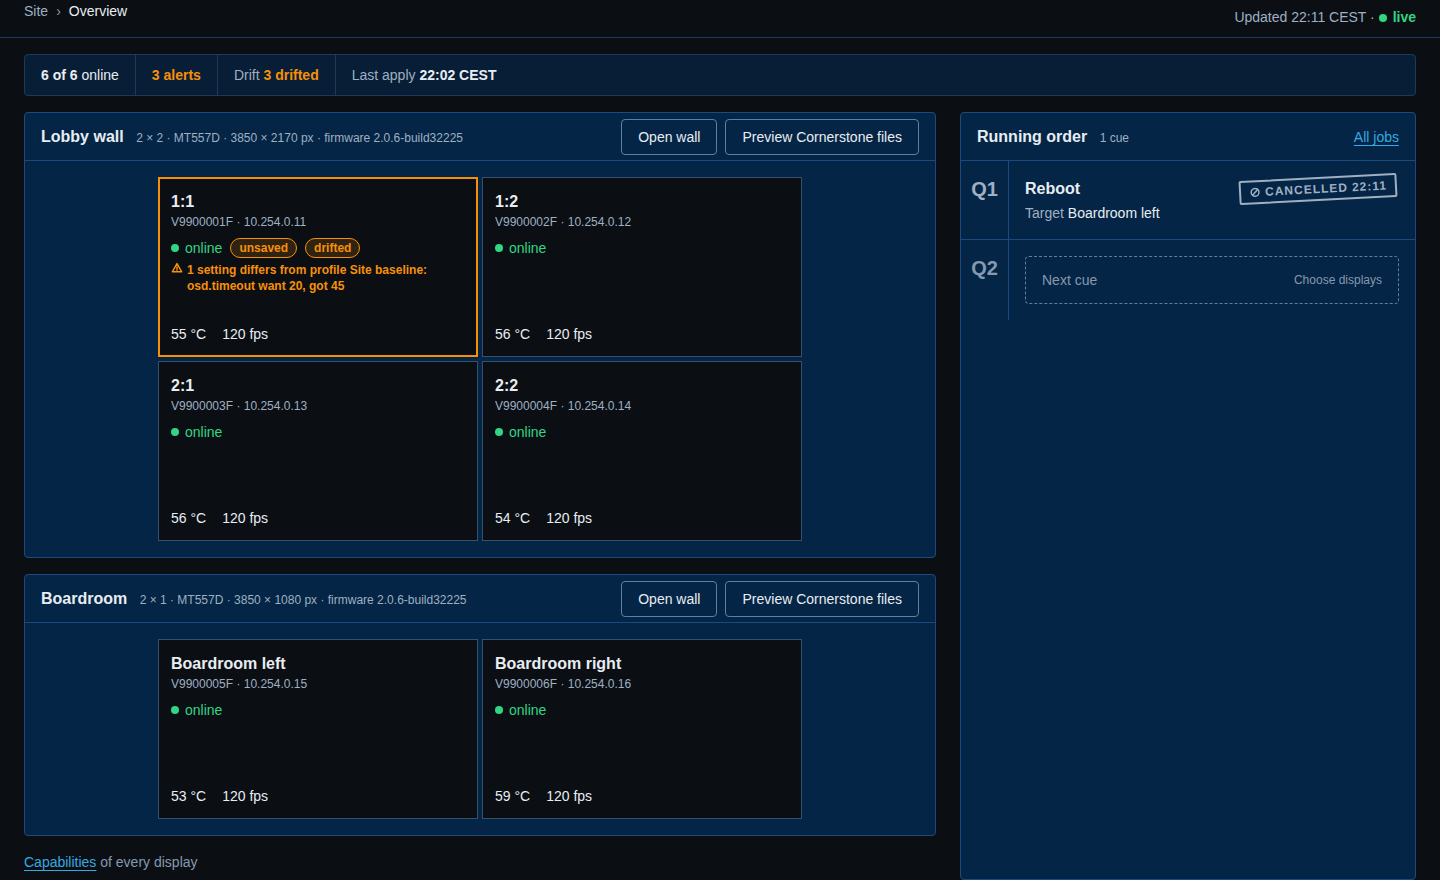
From left to right it shows:
- how many displays are online, for example 6 of 6 online;
- how many alerts are active, or No alerts;
- how many things have drifted. See Profiles and drift below;
- when the Cornerstone files were last written, for example Last apply 22:02 CEST.
Each figure is a link: the alerts figure opens Alerts, the drift figure opens Drift and the apply time opens Cornerstone files.
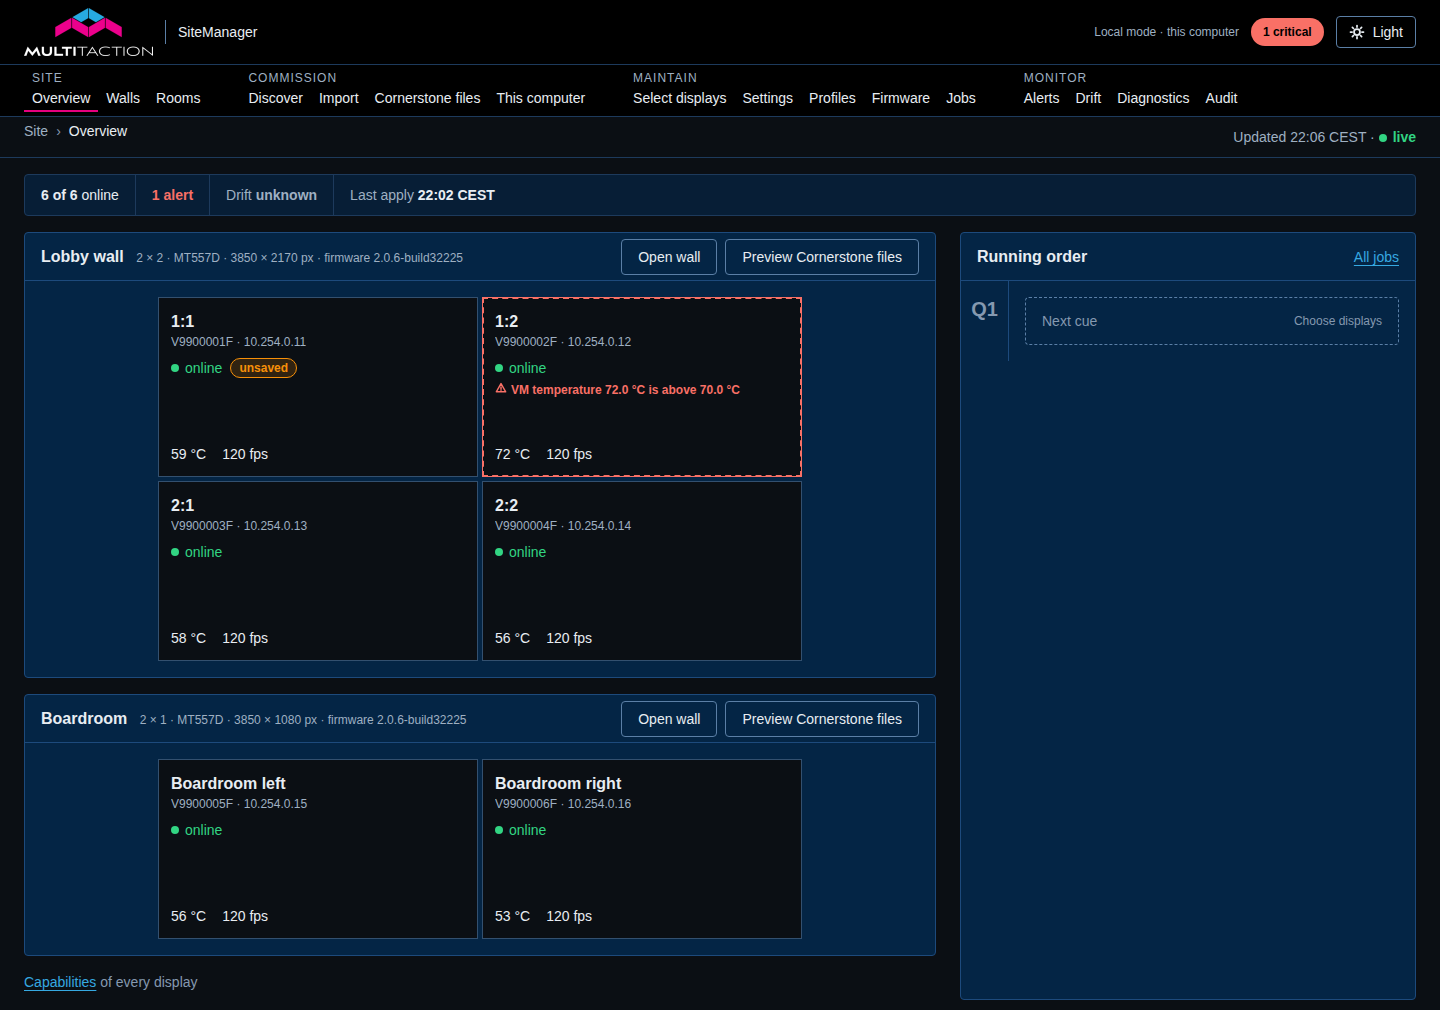
Each wall is drawn as a grid of tiles, like the real wall. A tile shows the display's name or its position (1:2 is the top row, second column), the serial number and address, its state, any alert, the temperature and the frame rate. The badges unsaved and drifted sit beside the state. A tile with a warning has a solid orange outline. A critical one has a dashed red outline.
The page updates by itself. The green live at the top right means it is receiving updates.
When something is wrong
Here the display 1:2 is too hot. Its tile has a dashed red outline and says why in words, and the black band at the top shows 1 critical.
A display that stops answering is shown as offline, with the reason, for example The display closed the connection. The line Technical detail under it has the raw error. The health line says 5 of 6 online.
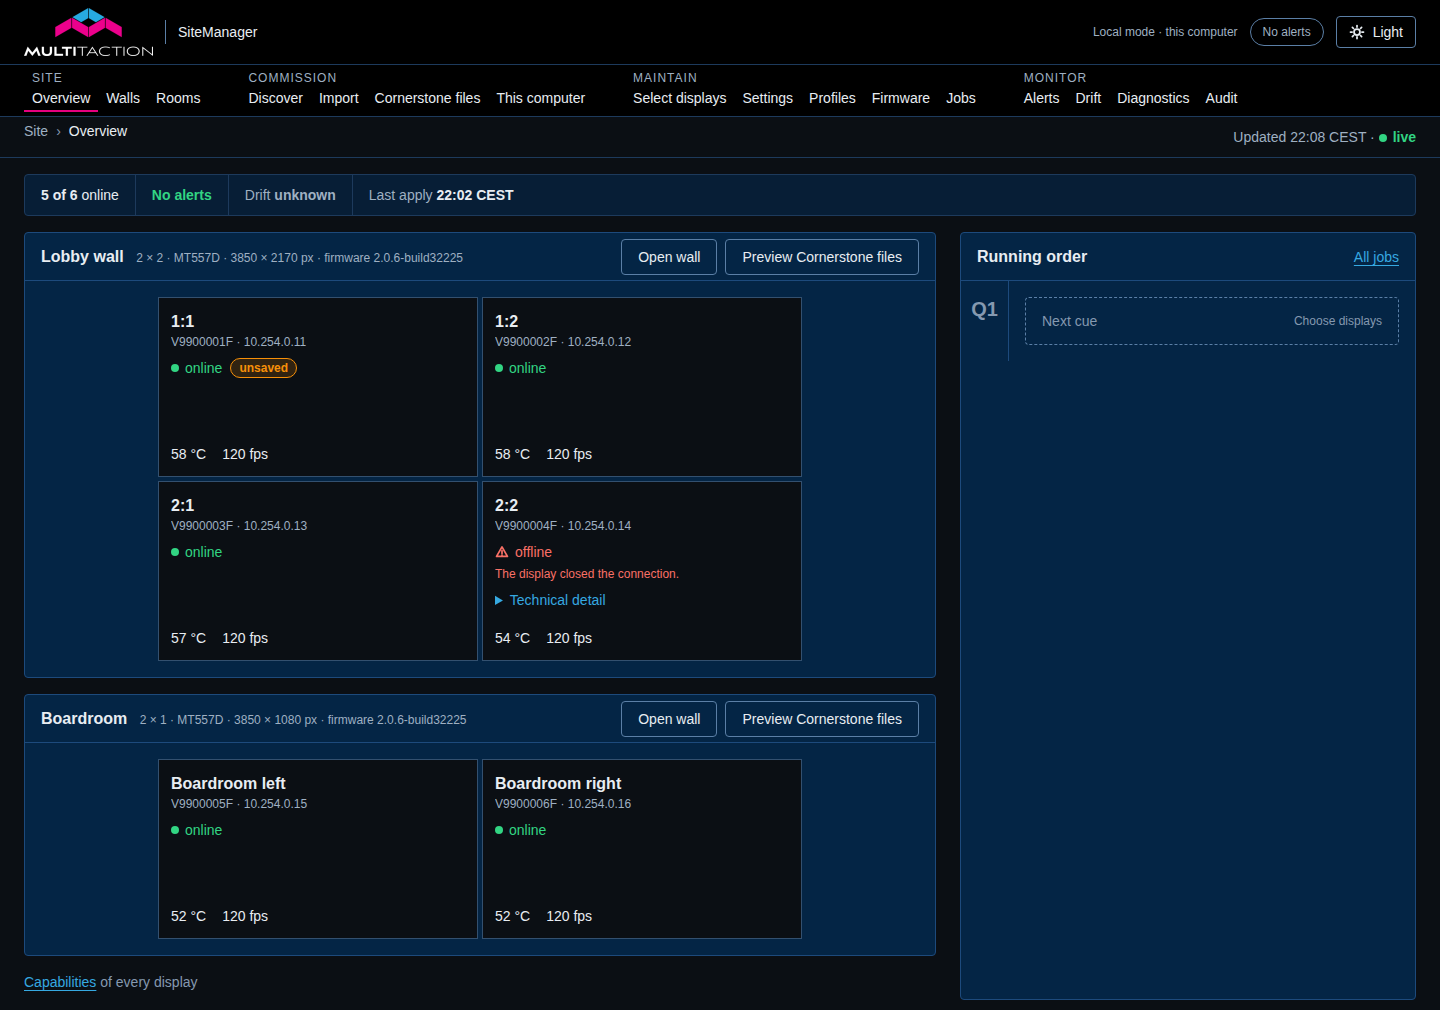
A display counts as offline after two missed readings. By default the alert for it comes after the display has been offline for one minute, so the tile can turn red a little before the alert appears. See Monitoring and history.
A display's page
Select a tile to open the page of that display.
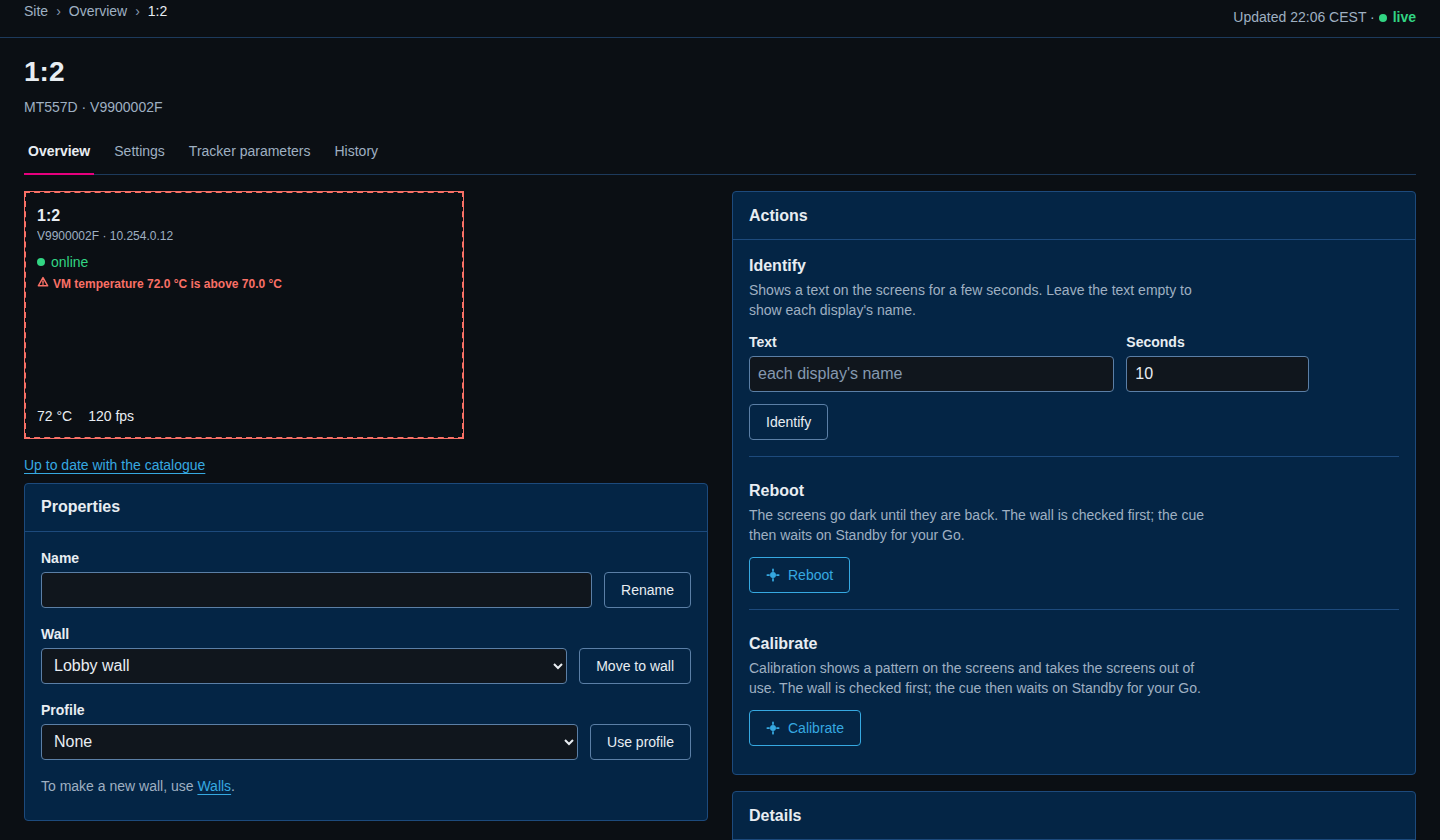
The tabs at the top are Overview, Settings, Tracker parameters and History. The Overview tab holds:
- the tile, with its live state, and a link under it that says whether its firmware is up to date;
- Actions: Identify, Reboot and Calibrate. Identify shows a text on the screen for a few seconds so you can see which display is which. It is safe at any time. Reboot and Calibrate wait on Standby. See Jobs below;
- Properties: the display's Name (Rename), its Wall (Move to wall) and its Profile (Use profile);
- Details: Identity, Capabilities and Remove from site.
On a phone the same page is a single column, with Properties first.
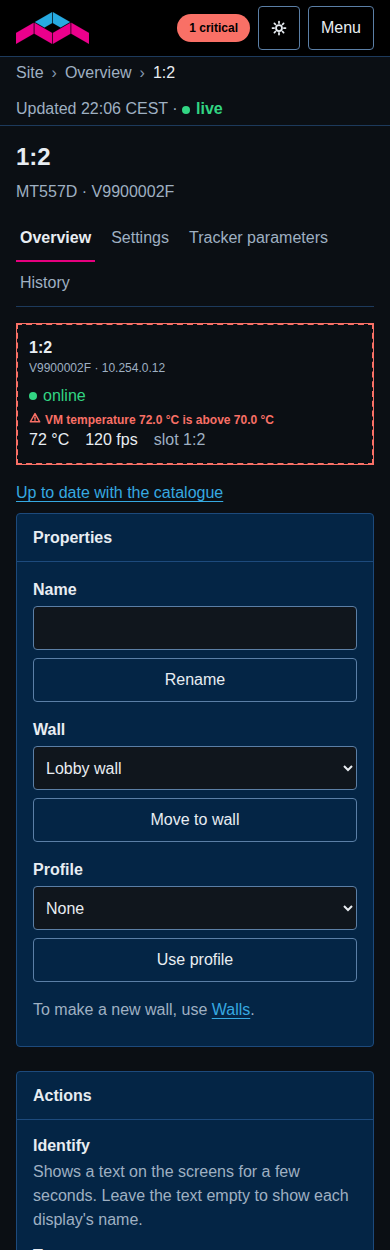
Select Identify when you stand in front of a wall and want to know which tile is which. Leave Text empty to show each display's name.
History
Select History to see how a display has behaved. Choose a range with 1h, 6h, 24h, 7d, 30d or 1y. There is one chart for each of temperature, power supply output, camera and tracker frame rates, online fraction, tracker restarts and touch traffic.
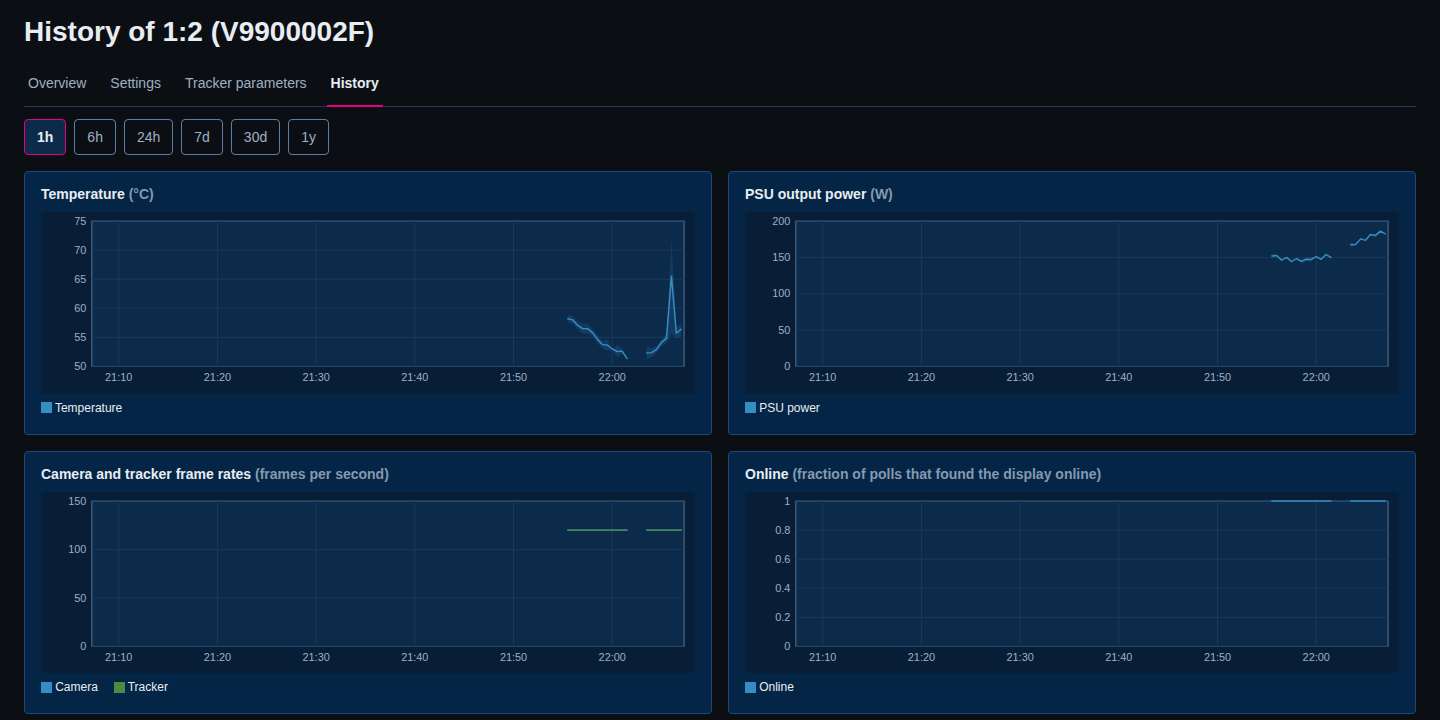
Read a chart like this:
- A gap in a line is time with no reading. In the picture the gap is where the service was restarted.
- The temperature chart shows the spike when display 1:2 ran hot.
- The online chart shows 1 when every reading found the display online.
Under the charts, Download as CSV saves the numbers. The wall page has a History link too, with one chart for all displays of the wall. History is kept at three resolutions, so you can look back a year. See Charts.
Look at History after an incident
An alert tells you a display crossed a limit. History tells you how long it was there, and whether it was getting worse before. Use the range 24h for the last day.
Alerts
SiteManager turns what it sees into alerts. A rule decides when something counts as an alert. A channel carries the alert to a person by email, webhook or syslog. Open Alerts in the menu, or select the alert pill at the top of any page.
The page has four parts: Active alerts, Rules, Delivery channels and Recent events.
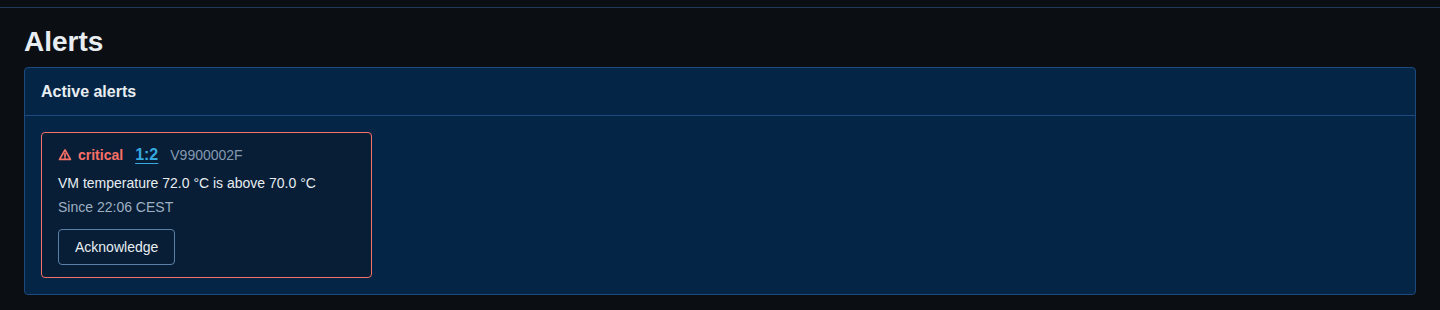
On a phone the page is one column.
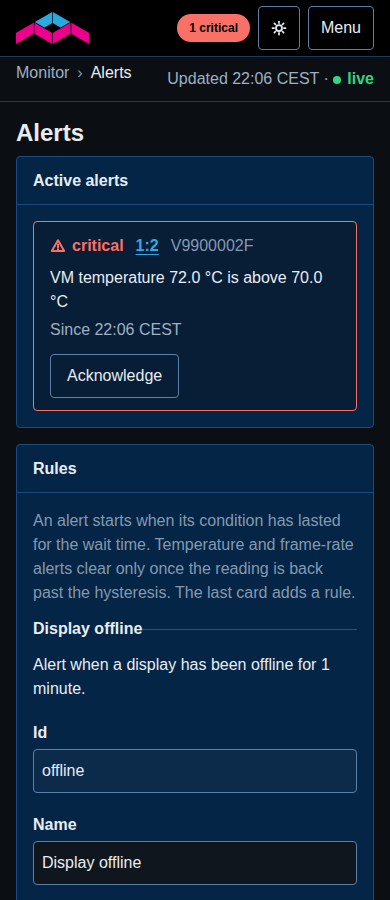
Active alerts
Each open alert is a card. It shows the severity, the display and its serial number, the message in words and when it started. The display name is a link to the display's page.
The only button on a card is Acknowledge. It records that you have seen the alert and who you are. It does not stop the alert and does not close it. After you select it, the card says Acknowledged by this computer (local mode) or by the name of the user, with the time, and the button goes away.
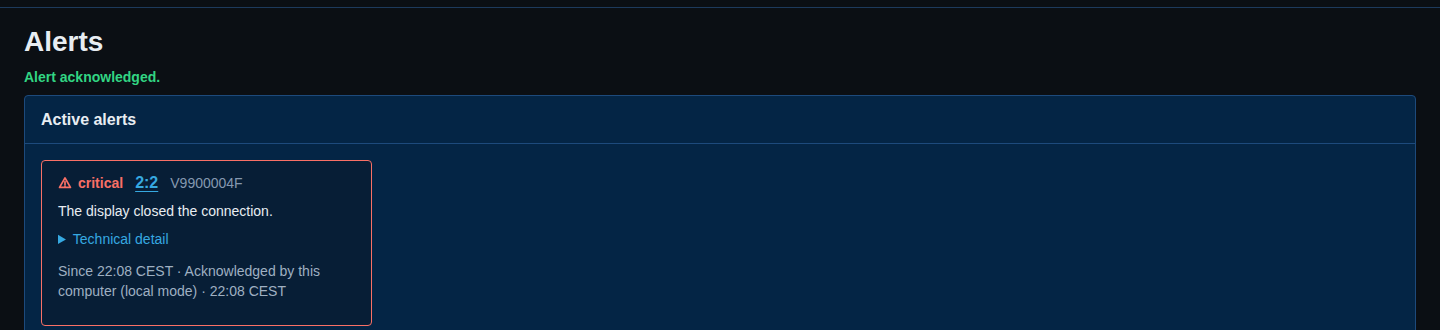
An alert closes by itself when the condition is gone. There is no button to clear one. For a high temperature, the alert clears only when the reading is back a few degrees below the limit, so it does not flap. For an offline display it clears when the display answers again. A closed alert leaves the card list and is written to Recent events.
Recent events
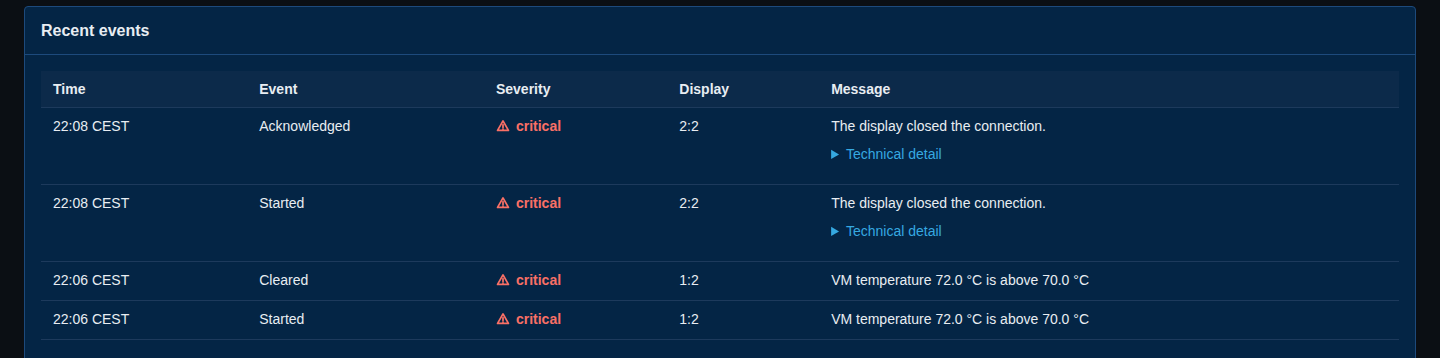
Recent events is the log. Each line has the time, the event (Started, Cleared, Acknowledged or Not listed), the severity, the display and the message.
Rules
Rules says when an alert starts. SiteManager comes with rules for an offline display, a high temperature, a critical temperature, a low frame rate, a restarting tracker, settings that differ from the profile, and Cornerstone files that differ from what the site generates. Each rule is a card with a one-line summary, for example Alert when a display has been offline for 1 minute.
You can change the severity, the wait time, the limit and which walls or displays a rule covers (Applies to). Tick Rule is on to switch a rule on or off, and Send the all-clear when it clears if you want a message when the alert ends. Add a rule adds a new one. Select Save rules to keep your changes.
Leave the rules alone at first. The defaults are sensible. The reference page lists every rule and its numbers: Rules.
Delivery channels
An alert on the screen helps only if someone is looking. A channel sends it to them. You can set up several channels, each with its own lowest severity (Send from severity), so a pager can get only critical alerts while a log gets everything.
To add one, select Add a channel under Delivery channels.
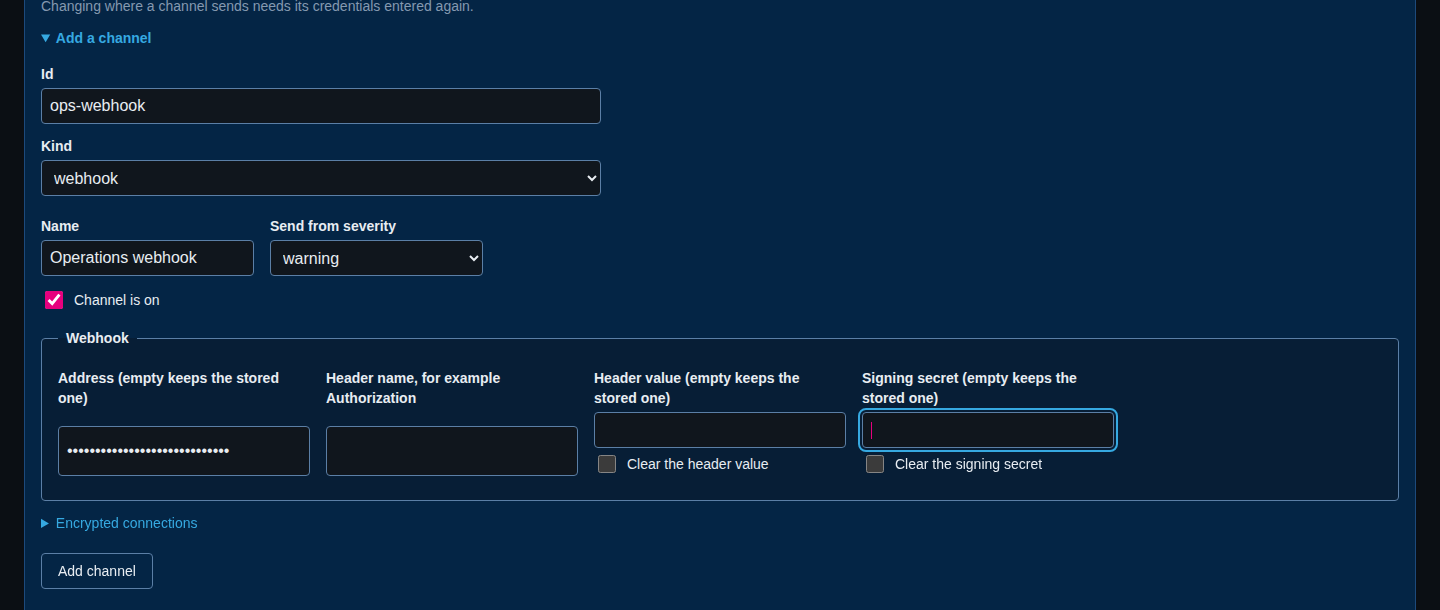
- Enter an Id (letters, digits and dashes; it cannot change later) and a Name.
- Choose the Kind:
email,webhookorsyslog. - Choose Send from severity:
info,warningorcritical. - Fill in the fields for the kind (below).
- Select Add channel.
Email needs a Mail server, a Port (leave it empty for the default of the security mode), the Security (starttls, tls or none), a From address and Recipients, separated by commas. A User name and Password are optional.
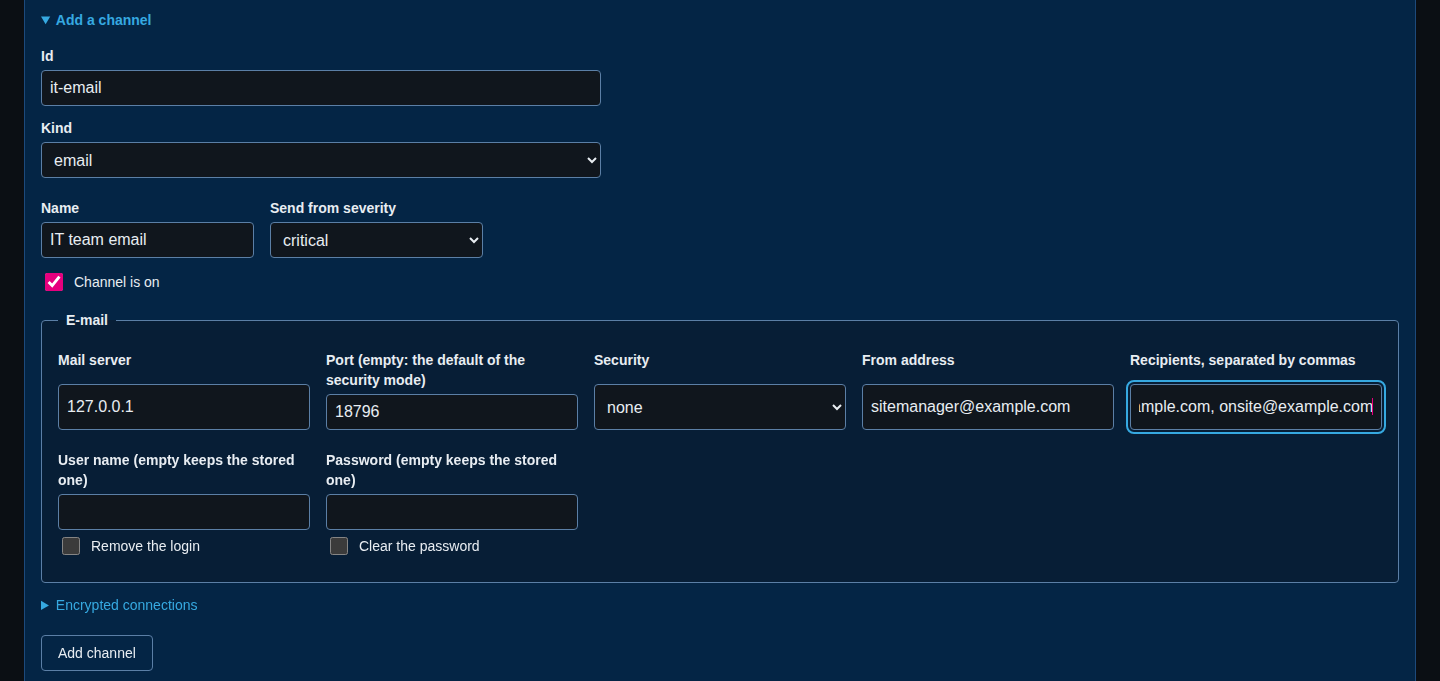
Webhook needs an Address. A Header name with a Header value (for example Authorization) and a Signing secret are optional. The service sends an HTTP POST with a JSON body.
Syslog needs an Address (host:port), a Protocol (udp, tcp or tls), a Facility (0 to 23) and an App name.
The password, the webhook address, the header value and the signing secret can be written but never read back. After you save them, the boxes show unchanged. Leave a box empty to keep the stored value. Tick Clear the password or the matching box to remove one. A webhook address is shown only as its scheme and host.
For a private certificate authority, open Encrypted connections and paste its certificate. Tick Do not check the server's certificate only on a network you trust.
Test a channel
Always test a new channel.
- Open the channel on the Alerts page.
- Select Send a test message.
- The page says Test message sent. Check that the message arrived where you expected.
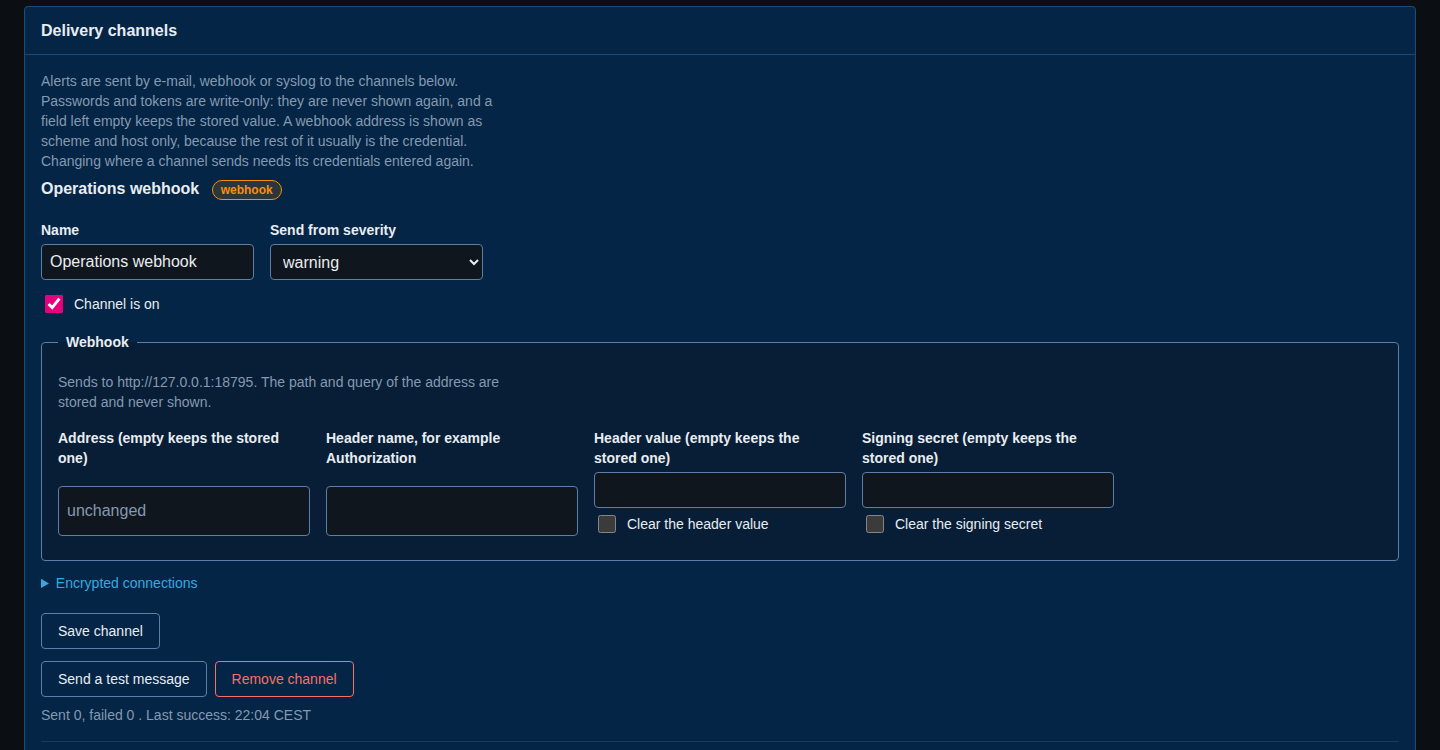
A test works even when the channel is switched off. It does not count as a sent message, so the Sent 0, failed 0 line does not change. You can send one test message every 5 seconds for each channel. If it fails, the channel shows the last error under its buttons.
A test message looks like the real thing, so the people who read it know what to expect:
- A webhook gets a JSON body with
"test": true. - A syslog collector gets one line, such as
<14>1 2026-10-13T20:05:00.288Z wallpc sitemanager - ALERT - [SiteManager] test: test offline (Site) - test message. - An email has the subject
[SiteManager] test: test offline (Site)and the textThis is a test message from SiteManager; no alert has fired.
A real alert uses the same channels. For the high temperature in the pictures above, the webhook got an event of type fired with the rule temperature-critical, the syslog line said critical: 1:2 (V9900002F, 10.254.0.12) temperature (Site) - VM temperature 72.0 °C is above 70.0 °C, and the email channel (critical only) got a message too.
Who can do what
Everyone who can open SiteManager can see the alerts. Changing rules or channels, sending a test and acknowledging an alert need a user who may change the site. A viewer sees the rules read-only and the channels as a summary. For the delivery limits, the webhook format and the signing, see Alerts.
Profiles and drift
A profile is a named set of display settings, for example your site baseline. Drift is when a display no longer matches its profile. SiteManager checks every 15 minutes and tells you which display and which setting.
Create a profile
- Open Profiles in the menu.
- Under New profile, enter an Id (letters, digits, dots, dashes and underscores) and a Name, such as
site-baselineandSite baseline. Select Create profile. - The profile page opens with Settings in this profile. Open a group, such as On-screen display or Picture. Tick the checkbox of a setting to put it in the profile, and give it a value. A setting you leave unticked is left alone.
- You can write Notes. Select Save profile.
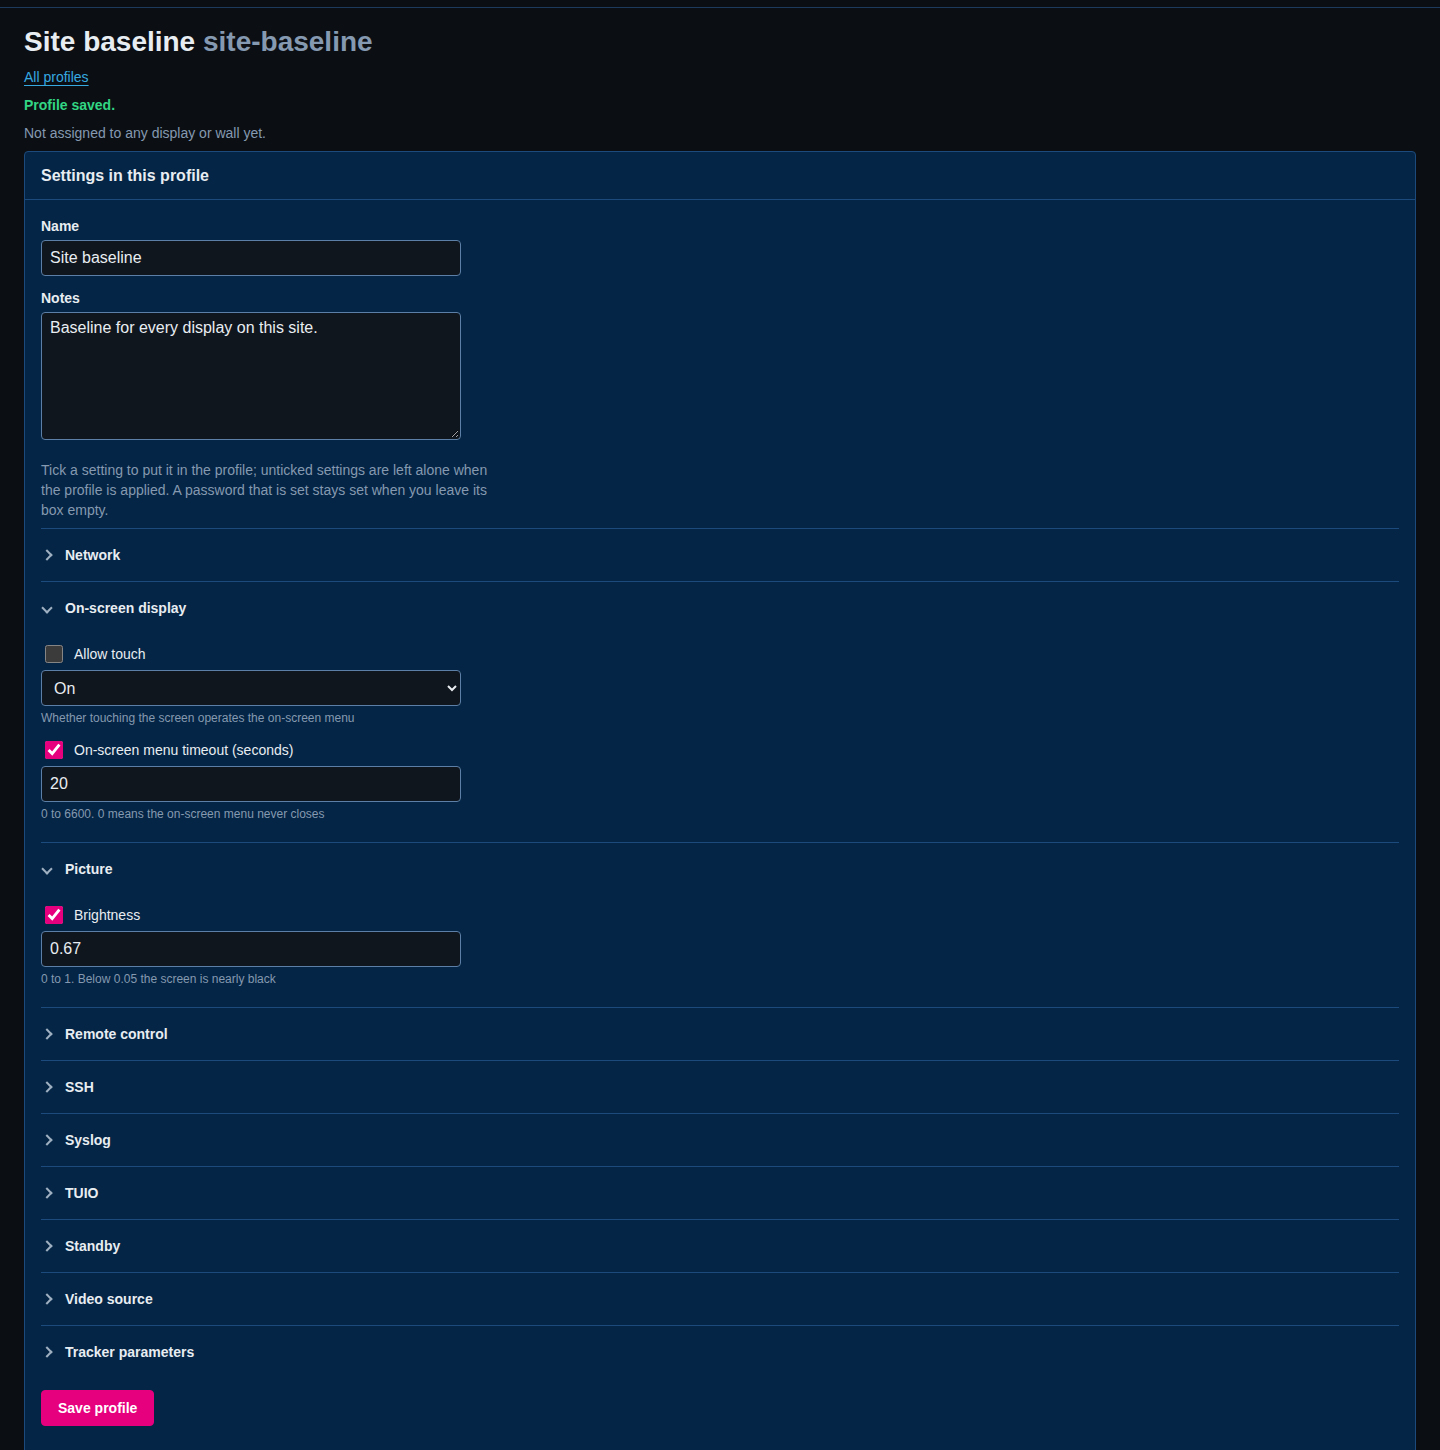
A profile can hold any setting that Settings can change, except a display's network address. The page tells you it saved: Profile saved.
Start from what the displays have
To make a baseline from a display that is right, open Settings for it, read its values, and tick the same values in the profile. A profile that matches the displays starts in sync.
Give the profile to displays
A display uses its own profile, or if it has none, the profile of its wall.
- On a wall page, choose the Profile and select Use profile.
- On a display's page, under Properties, choose the Profile and select Use profile.
The Profiles list now shows where the profile applies and how the displays compare.
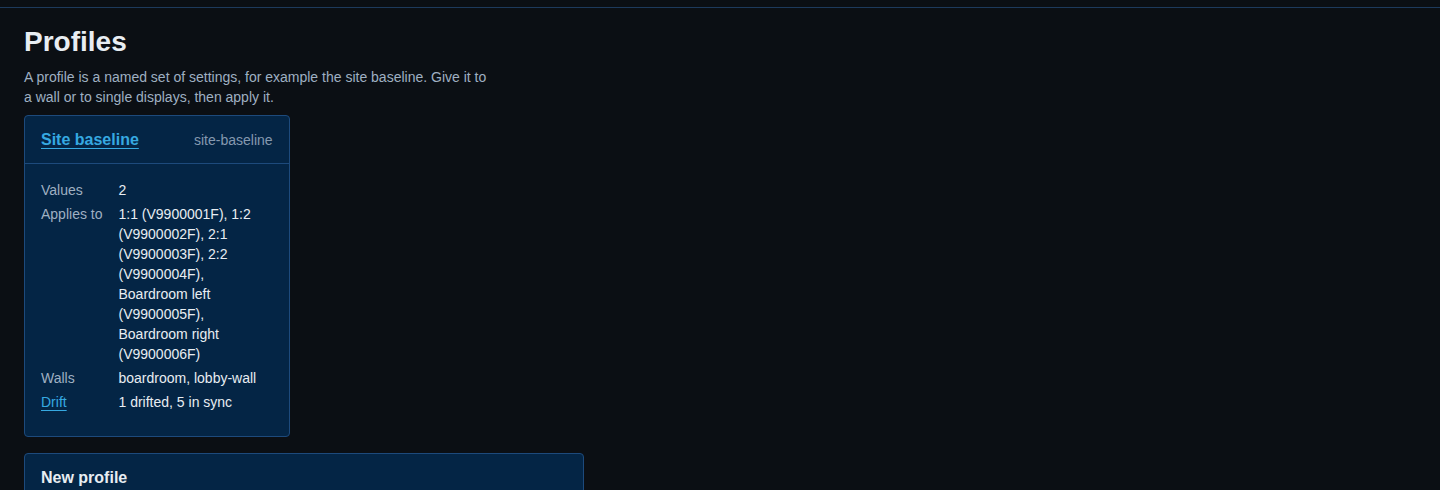
Giving a profile to displays does not change the displays. Only Apply on the profile page writes to them, and that is a job that waits on Standby when it needs to. Applying a profile is described in Profiles and drift. Do it deliberately, on a wall that nobody is using.
Read the Drift page
Open Drift in the menu. Select Check now to run a check at once. Last check shows when the last one ran. A check only reads. It writes nothing to a display or a file.
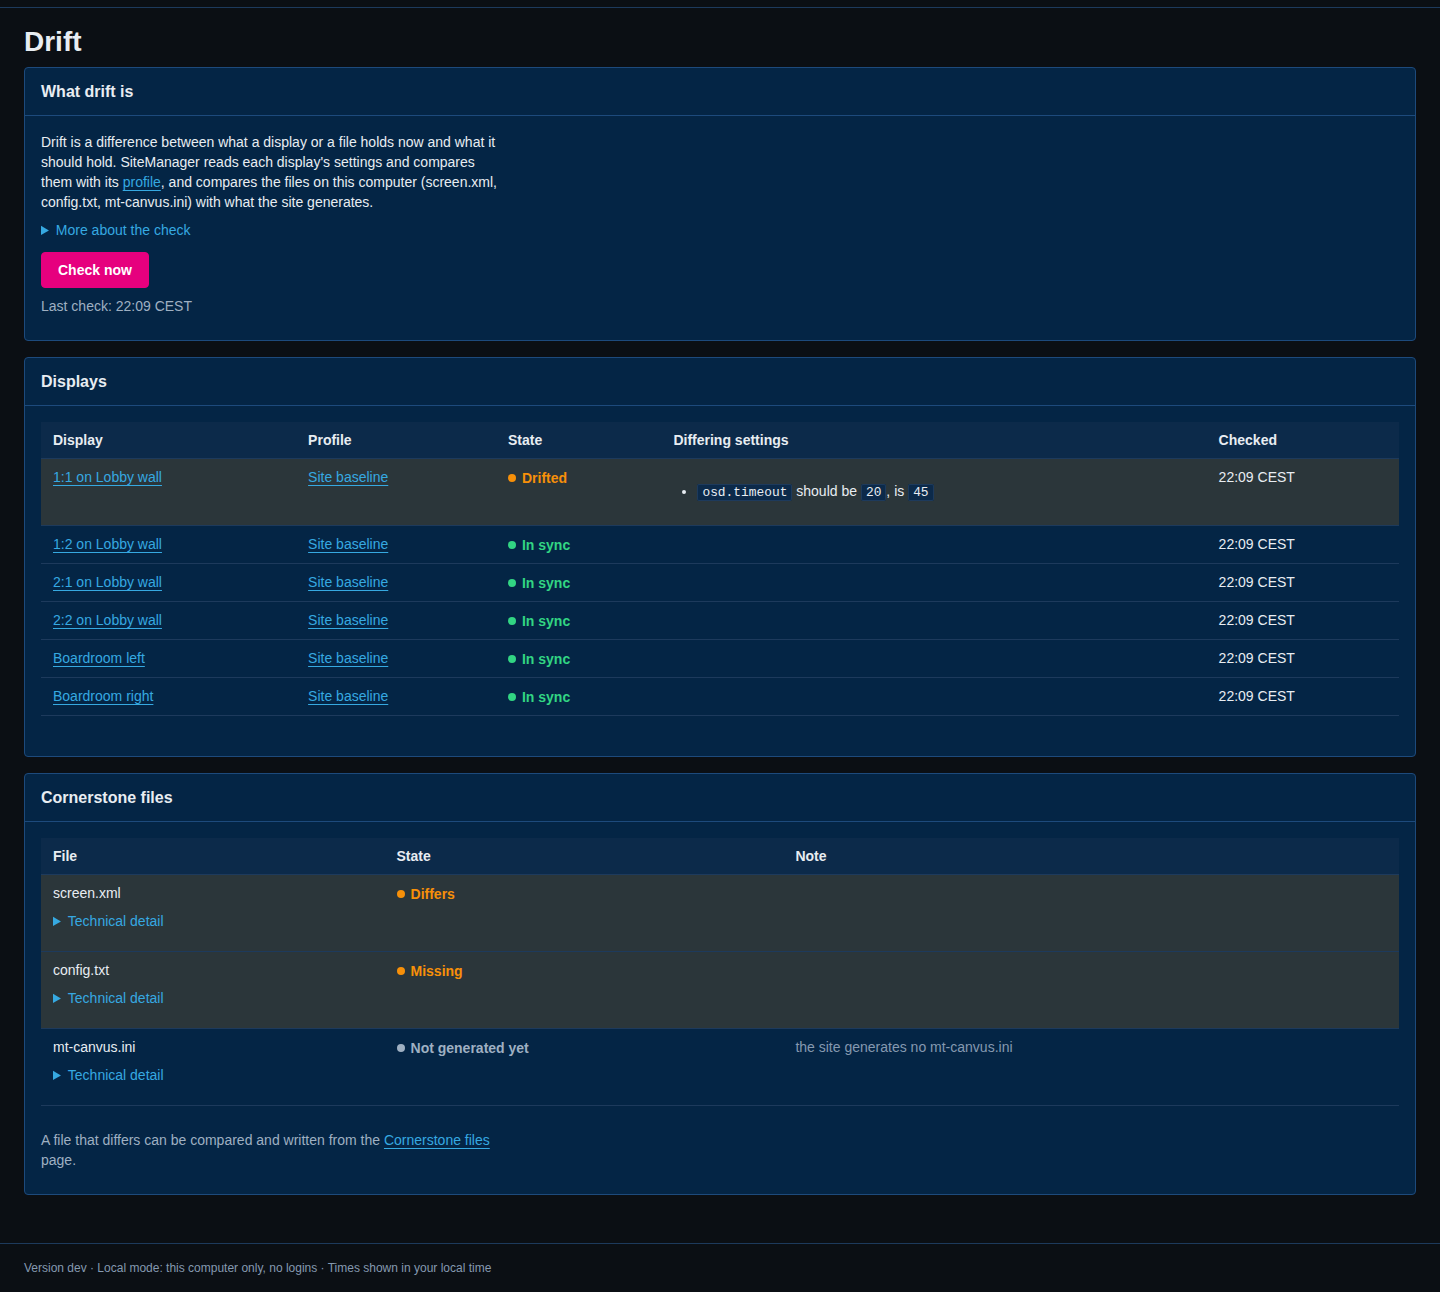
The Displays table has one row for each display. The State is:
- In sync: every setting in the profile matches.
- Drifted: at least one setting differs. Differing settings lists each one as
osd.timeout should be 20, is 45. - Unknown: SiteManager could not tell, for example because the display was offline. The reason is shown.
- No profile: the display has no profile.
The Cornerstone files table does the same for the files on the wall computer. Differs means the file is not what SiteManager would generate. Missing means the file does not exist. Not generated yet means there is nothing to compare, and the note says why. A file that differs is compared and written on the Cornerstone files page.
The same findings appear on the overview. In the first picture, tile 1:1 has the drifted badge and a line: 1 setting differs from profile Site baseline: osd.timeout want 20, got 45. It also has the unsaved badge, which means a setting was changed on that display and not yet saved on it. Drift raises the alerts Settings differ from the profile and Configuration files differ. They clear by themselves when the next check finds everything right.
What to do about a drifted display depends on which side is wrong:
- If the display is wrong, apply the profile to it, or change the setting by hand.
- If the profile is wrong, edit the profile.
For the rules of a check, see Drift.
Change settings on several displays
To change one setting on many displays, use Select displays and Settings.
- Open Select displays. The displays are grouped by wall.
- Tick the displays you want, or tick Whole wall to include every display on that wall.
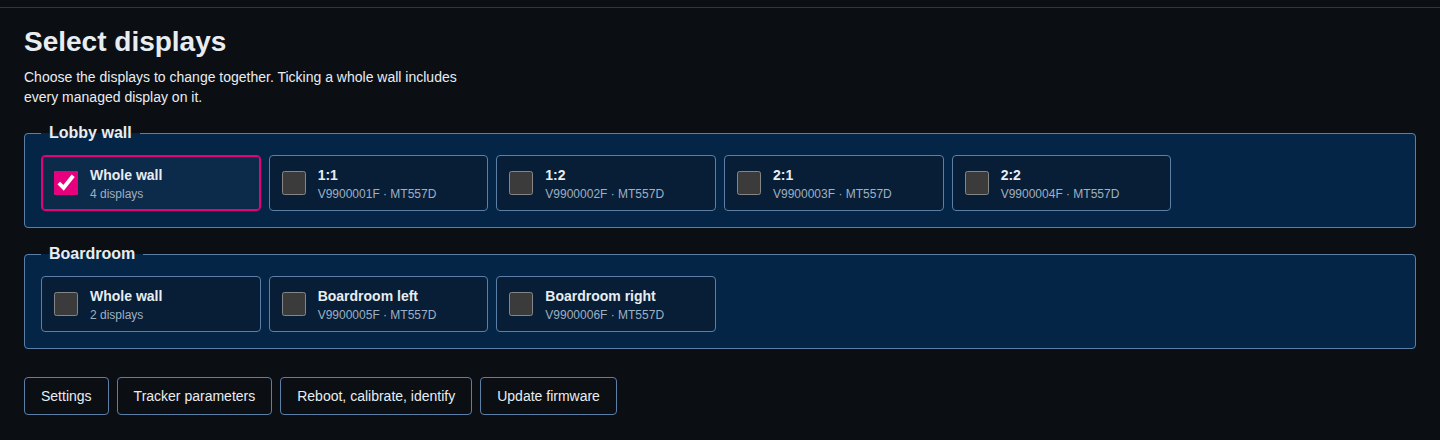
- Select Settings. The page lists the displays it applies to at the top. Change selection goes back.
- Choose a group in the tabs: Network, On-screen display, Picture, Remote control, SSH, Syslog, TUIO, Standby or Video source.
- Change the field. A field that says varies has different values on the selected displays and is left alone unless you change it.
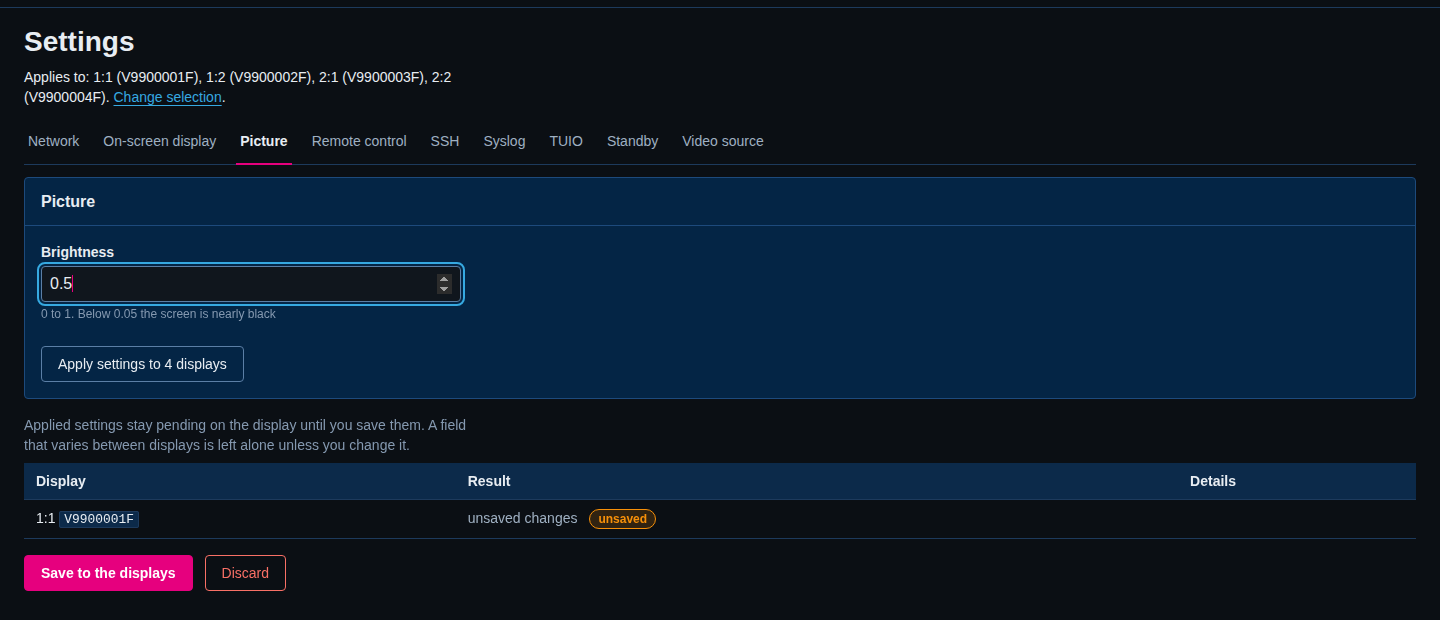
- Select Apply settings to 4 displays. SiteManager writes to the displays and lists the result for each one: OK, failed or outcome unknown, with the old and new value.
- Check the picture. If it is right, select Save to the displays. If it is not, select Discard.
Applied is not saved
Settings you apply stay pending on the display until you select Save to the displays. A display that restarts before that loses them. A display with pending changes has the unsaved badge on the overview. The picture above is filled in but not applied: nothing has been sent.
Two things to be careful with:
- Changing the IP address moves the display. Do it on one display at a time. The page asks you to confirm.
- Apply a change to a whole wall when nobody is using it. Brightness changes the picture at once.
For all fields, see Settings. For a change you will repeat, use a profile instead.
Jobs
A job is something SiteManager does that takes a while: a reboot, a calibration, a firmware update or applying a profile. A job runs in the service, so it keeps going if you close the browser.
Jobs in the menu lists them as cues, with numbers Q1, Q2 and so on. The same list is the Running order on the overview.

Standby and Go
Some actions disturb a wall: a reboot, a calibration and a firmware update. SiteManager does not start them at once. It creates a cue and checks the wall first. The cue waits on Standby, which means it waits for you.
To see it, choose a display in Select displays, select Reboot, calibrate, identify, and then Reboot. The cue page says what SiteManager found:
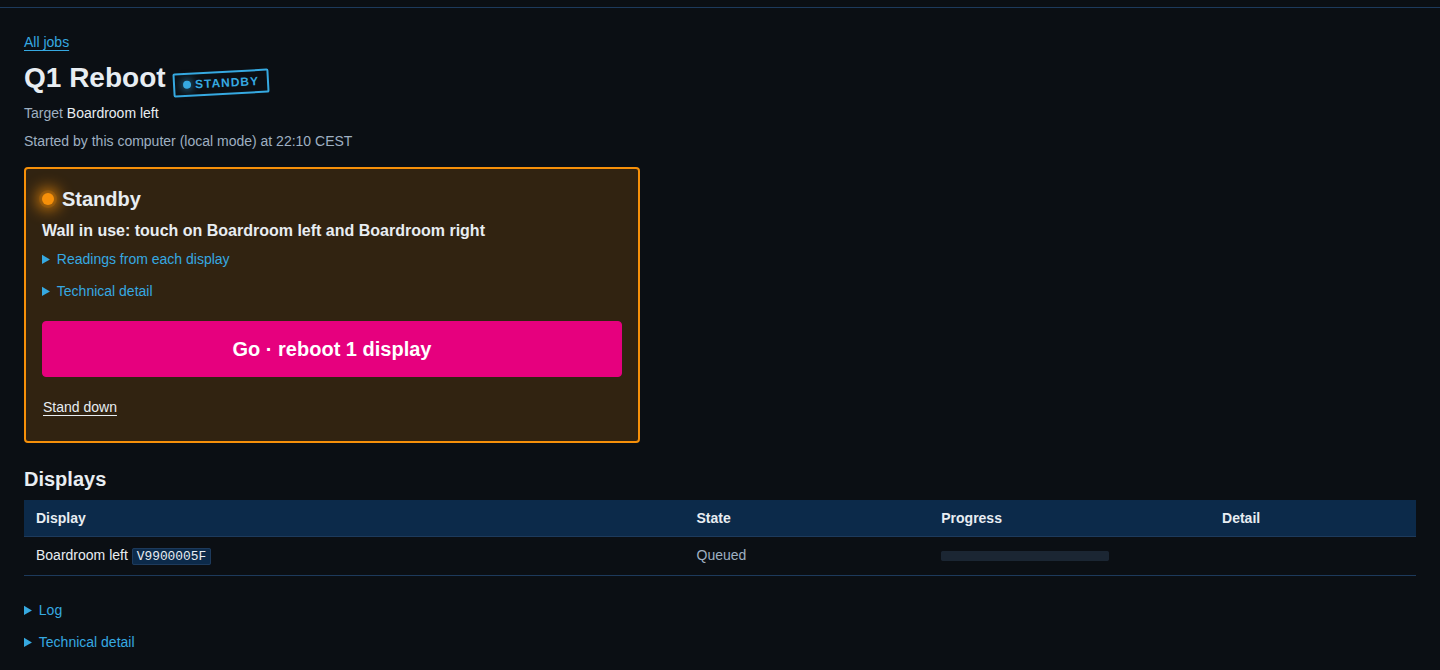
- It says whether the wall is in use. Wall in use: touch on Boardroom left and Boardroom right means someone is touching it. Wall idle · nobody touching means no one is. Can't tell whether the wall is in use means SiteManager could not read the touch traffic and treats it as in use.
- One button, here Go · reboot 1 display, says exactly what it will do. Select it only when you want that.
- Stand down cancels the cue. Nothing has been sent to a display at that point.
Open Readings from each display to see why SiteManager decided what it did. The box is orange when the wall is in use and blue when it is idle.
Take your time on Standby
A cue can wait on Standby as long as you like. If the wall was idle when you looked and someone starts touching it later, SiteManager checks again when you select Go, and goes back to Standby if the wall is now in use.
While a job runs
Select a cue to see its page. It has one line for each display with a progress bar, and a Log. A job on a display blocks a second job on the same display. SiteManager refuses the second one and names the first.
Cancel is on the page of a running job. A reboot or calibration that has already started on a display is not stopped. SiteManager asks you to confirm and tells you so: Cancel this job? A reboot or calibration that has already started is not stopped on the display.
When a job ends
A finished cue gets a stamp: DONE, FAILED or CANCELLED. The page says when it finished.
A failed cue says in plain words what went wrong. The raw error is under Technical detail. It has a Retry button. Retry starts a new job for the displays that did not finish, and the new job waits on Standby until you select Go. Nothing is sent by Retry itself.
A job that was running when the service stopped is marked interrupted. Check those displays, then retry.
From the command line, sitemanager jobs lists and follows jobs. See Jobs for the states and Standby and Go.
A daily routine
A short routine that takes a few minutes:
- Open Overview. Is the health line green? If not, follow the figure that is not.
- Open Alerts. Acknowledge what you have seen. Read Recent events for what happened overnight.
- Open Drift once a week and select Check now.
- After any change, check Jobs for failed cues.
When something needs a closer look, the next pages are Logs and diagnostics and Tips and tricks.