Analytics
The Analytics screen shows how visitors interact with your Showcase walls. You can track sessions, individual leads and content engagement, and export the underlying data to CSV files.
Data is captured by the Showcase player as visitors use their Codice cards, open widgets, view PDFs, play videos and send content by email. Each event is attached to the visitor's identity (if known) and to the active application session, so you can reconstruct an entire visit from start to finish.
Who can see analytics
Analytics appears in the left navigation for administrators and authors. The analytics data itself, including the CSV downloads and the webhook settings, is available to administrators.
The analytics overview
Click Analytics in the left navigation to open the dashboard. Four summary cards at the top show the current totals: Leads (identified or anonymous visitors), Sessions (application runs), Events (all captured interactions), and Contacts (individual screen touches, recorded as object-down events).
Four tabs below the summary cards let you drill into the data:
- Leads — one row per visitor, with expandable event history.
- Sessions — one row per application run, with expandable timeline.
- Content — aggregated engagement per widget and event type.
- Export — CSV downloads and webhook configuration.
Use the Refresh button in the top right to reload all data on demand.
Browse leads
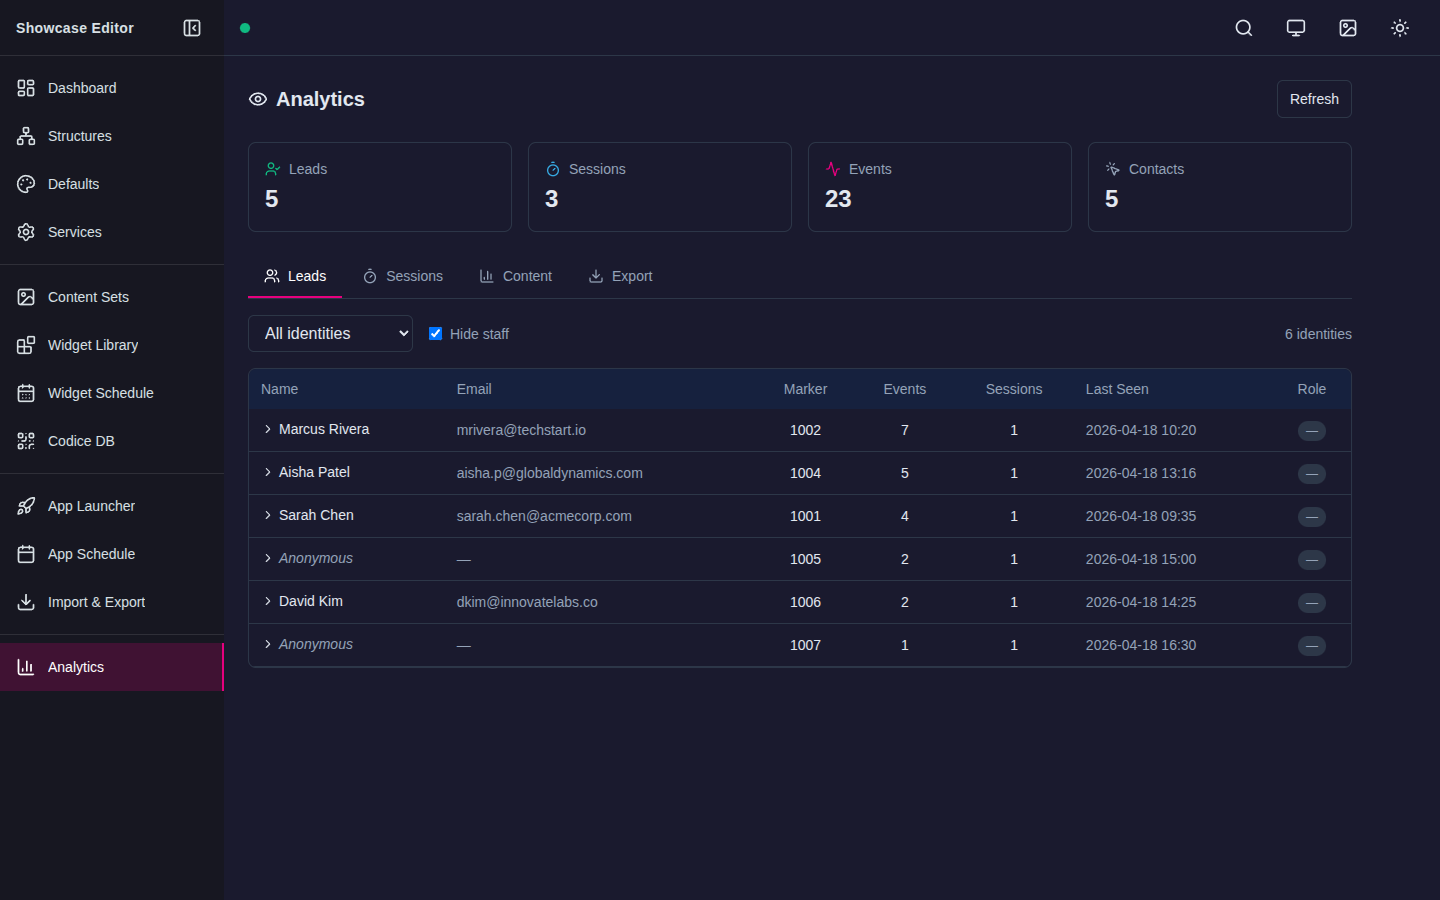
The Leads tab lists every visitor the system has seen, sorted by activity. Registered visitors, whose Codice card is registered with a name and email address, show that name and email. Other visitors appear as Anonymous.
To investigate a specific lead:
- Use the filter dropdown above the table to show All identities, Registered only, or Anonymous only.
- Select the Hide staff checkbox to exclude identities that have been flagged as internal staff. Staff visits typically come from testing, setup and demo walkthroughs, and will skew public-facing metrics if left in.
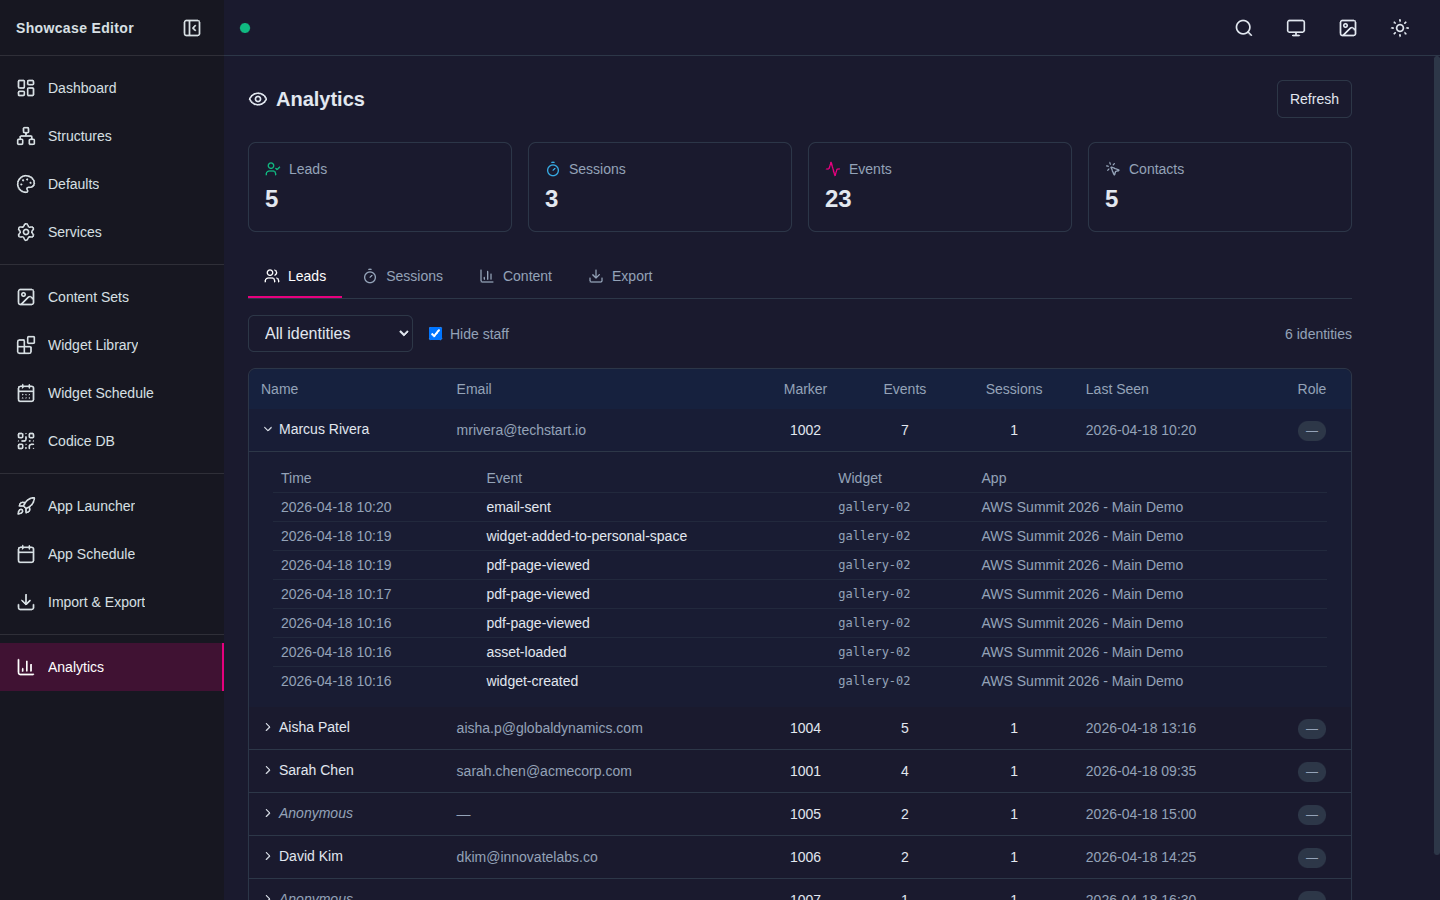
- Click any row to expand it. The expanded view shows every event the visitor triggered — the time, event type, the widget or asset involved, and the application where the interaction happened.
- To mark a visitor as staff, click the dash (—) button in the Role column and choose Staff. The lead will be hidden whenever the Hide staff filter is active.
Tip
Flag your own test Codice card as Staff as soon as your wall goes live. This stops rehearsal runs and setup-day activity from inflating your engagement numbers.
Browse sessions
The Sessions tab shows one row per application run. A session starts when the Showcase player launches an app and ends when the app is closed or switched.
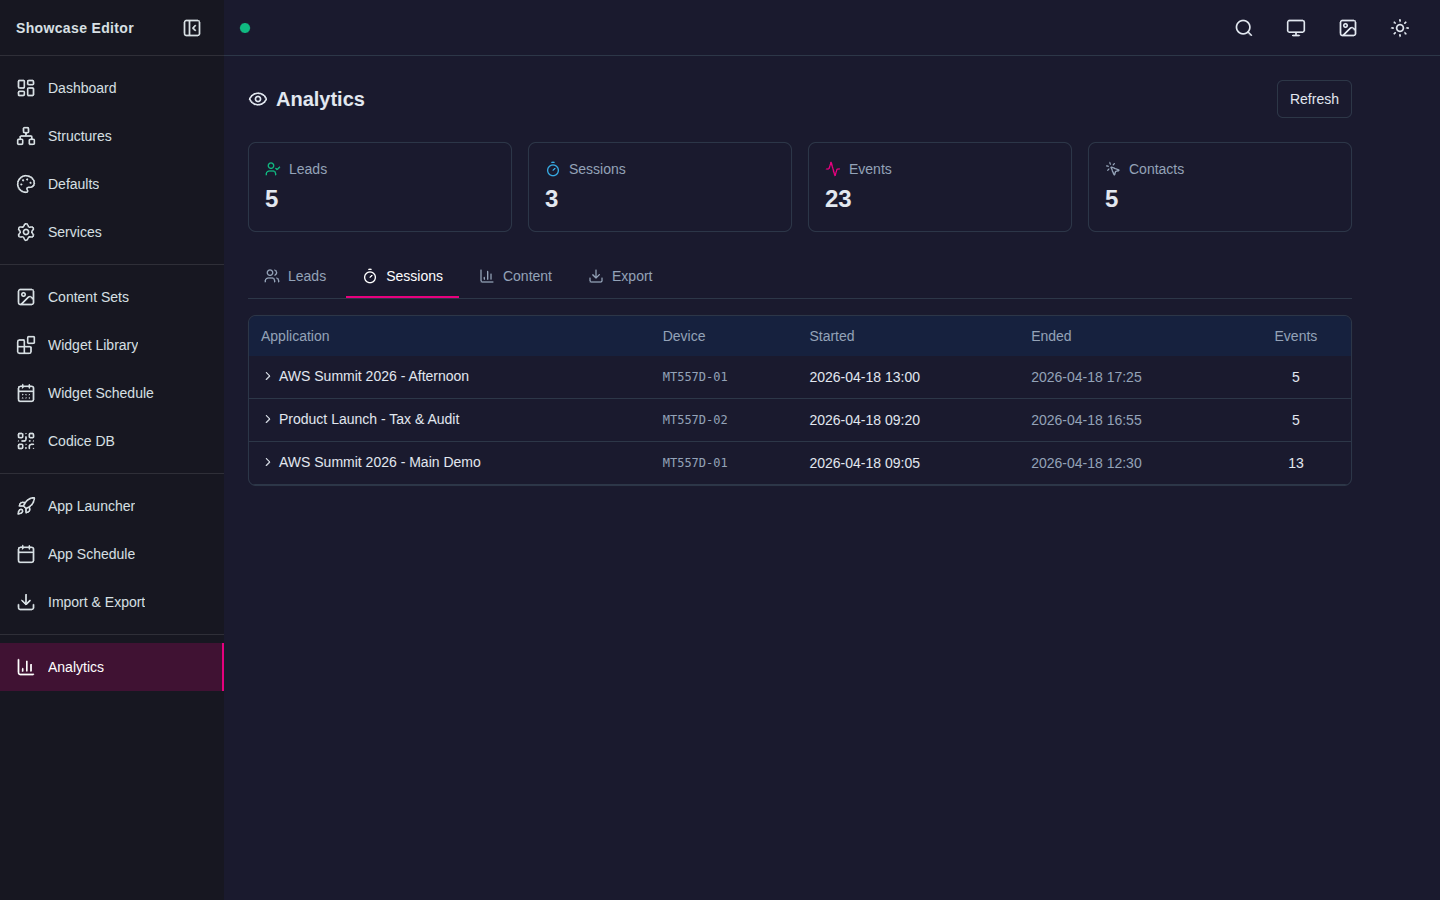
Each row shows the application name, the device that was running it, the start and end times, and the number of events captured during the session.
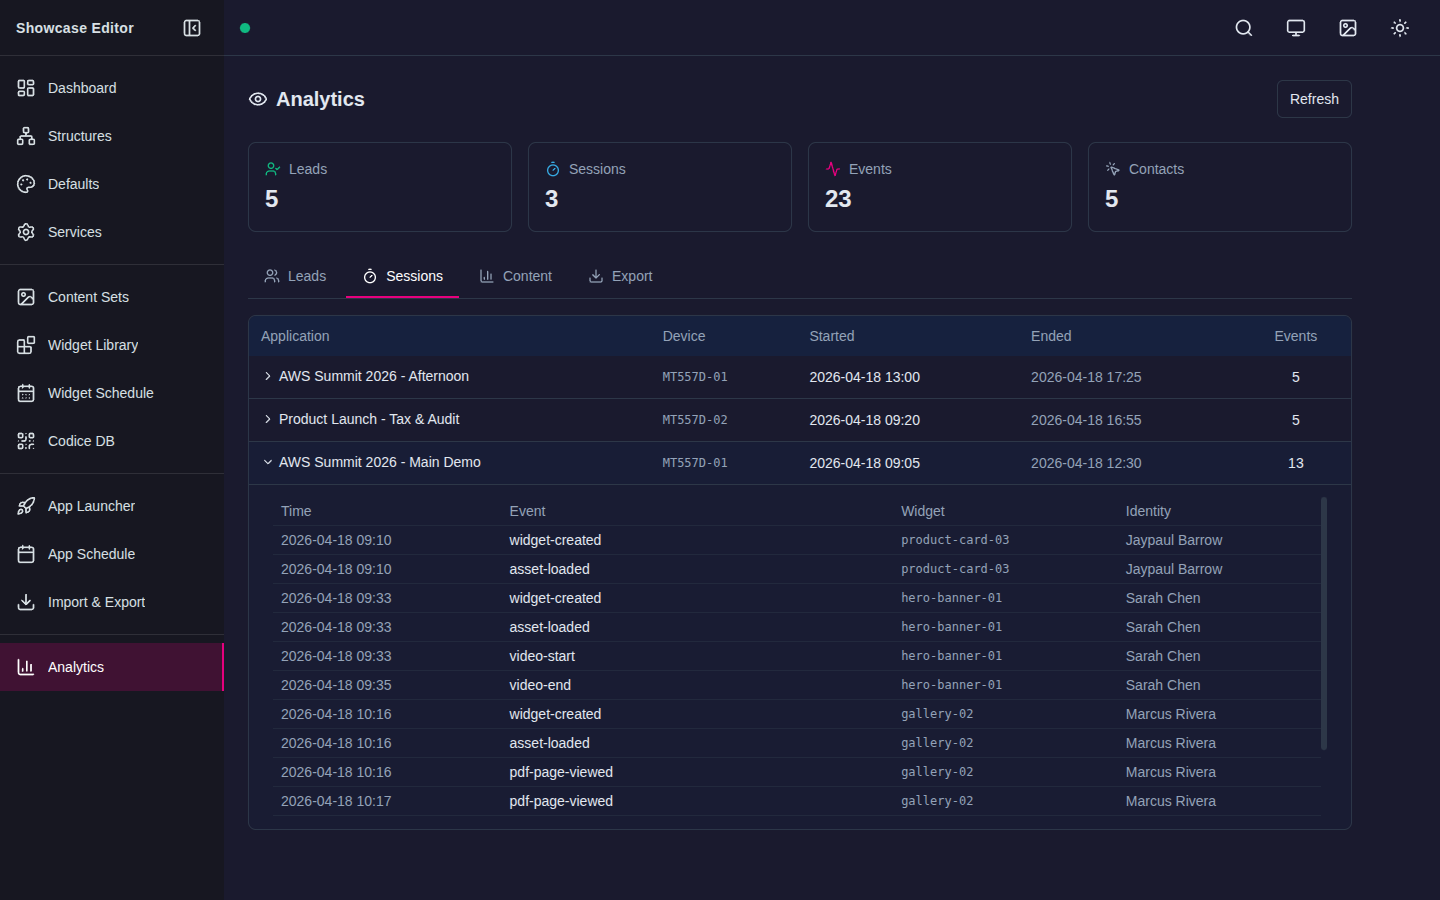
Click a row to expand the session timeline. The timeline lists every event in chronological order, together with the widget involved and — where a Codice card was used — the identity of the visitor.
Tip
Use session timelines to understand a single visit end-to-end, for example during a scheduled demo or customer meeting. They are also useful for diagnosing content that visitors open but never interact with.
Analyze content engagement
The Content tab aggregates events across all sessions to show which content is being used and how often.
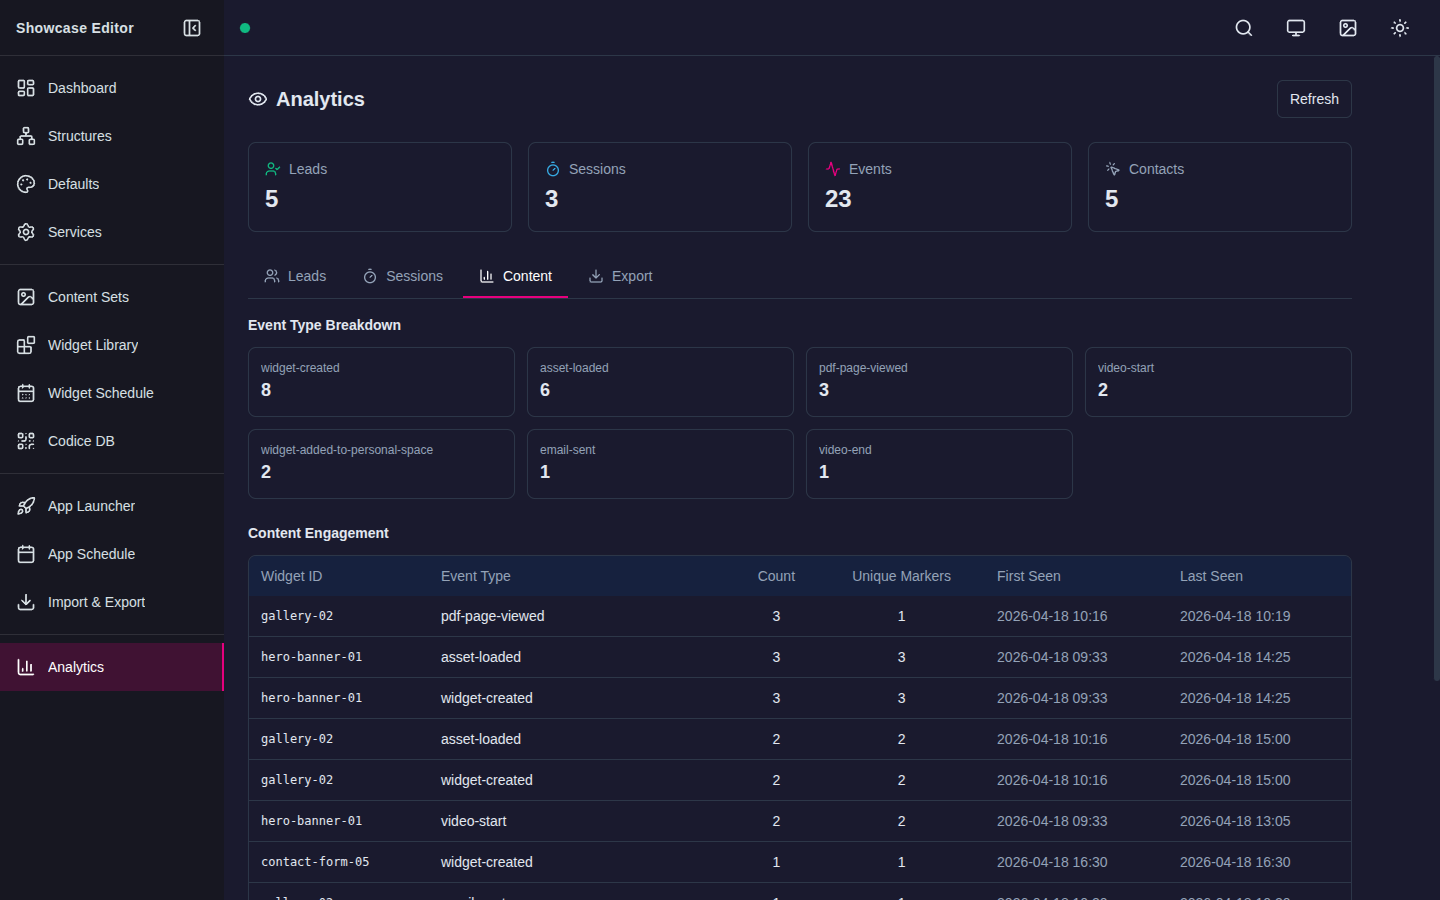
The Event Type Breakdown cards show how often each kind of event has occurred across the whole wall — for example, how many widgets have been opened, how many PDFs have been viewed, or how many videos have been started.
The Content Engagement table lists each widget together with the event types it has generated. For each row you see:
- Widget — the widget or asset the events relate to.
- Component — the part of the widget that produced the events.
- Event Type — the kind of interaction.
- Count — total number of events.
- Unique Markers — how many distinct visitors produced the events.
- First Seen and Last Seen — the time range over which the events were captured.
Tip
The gap between Count and Unique Markers is useful signal. A widget with a count of 12 from 12 unique markers is broadly interesting; a widget with a count of 30 from two markers is usually being driven by staff or by a single returning visitor.
Export data
The Export tab lets you download captured data as CSV files, and configure a webhook endpoint.
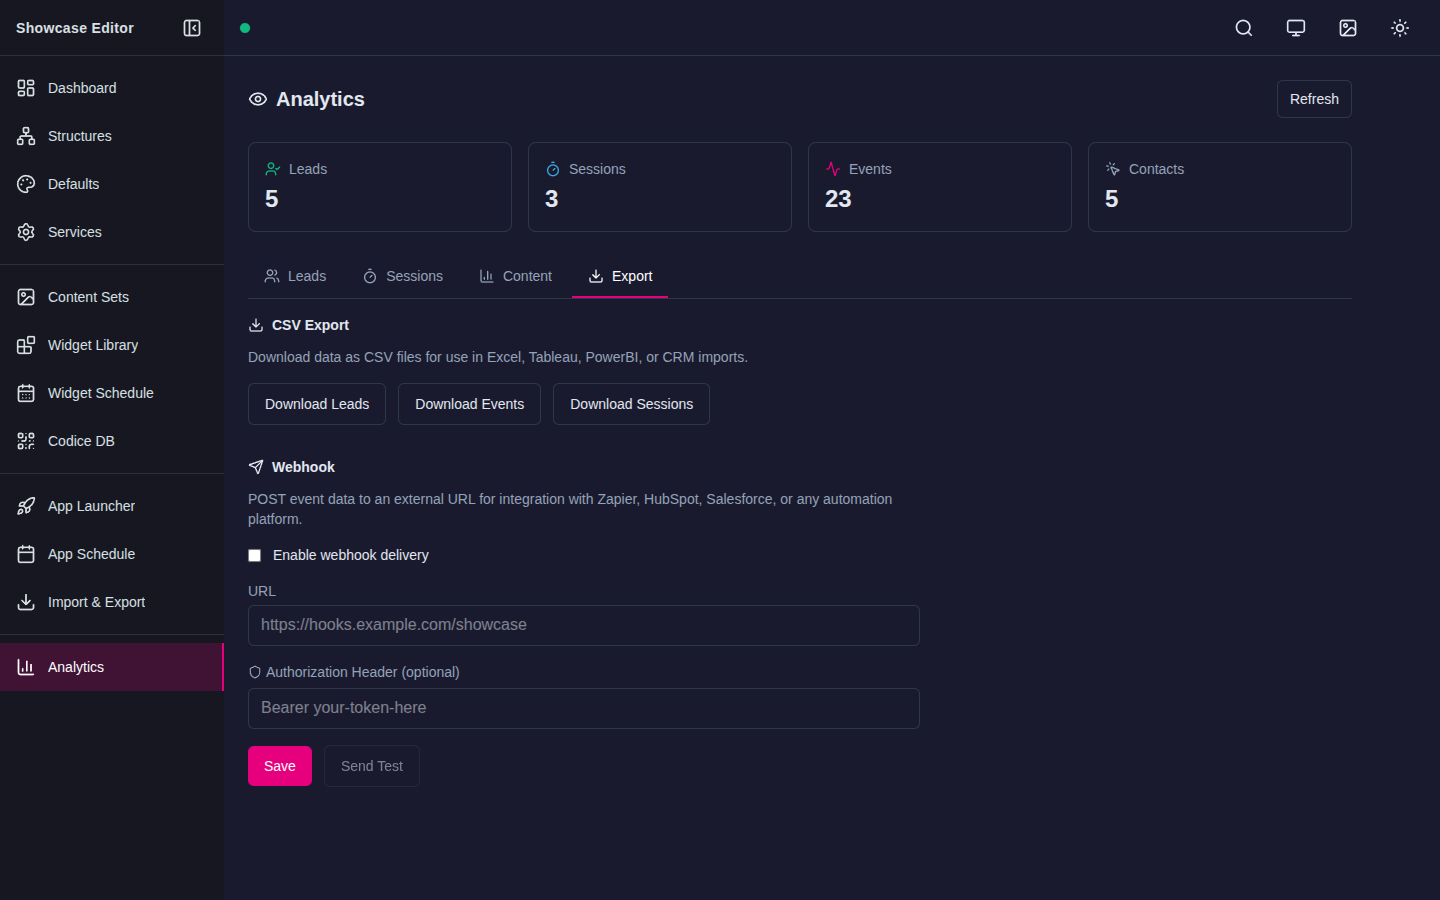
Download CSV files
CSV files can be opened directly in Excel, Numbers, Google Sheets, Tableau or PowerBI, and they can be imported into most CRM systems.
Three downloads are available:
- Download Leads — one row per identified or anonymous visitor, with totals and the most recent activity time.
- Download Events — the full event log, one row per event.
- Download Sessions — one row per application run.
Click a download button to save the corresponding file to your computer.
Configure a webhook
You can store the details of an external endpoint and send a single test delivery to it, so that the destination is recorded and can be verified. Automatic delivery of each new event as it happens is not available yet:
- Enter the destination URL that will receive the POST request.
- (Optional) Add an Authorization Header — for example,
Bearer your-token-here— if the receiving service requires authentication. - Click Save to store the configuration.
- Click Send Test to POST a sample payload and verify that the receiving service is reachable. A success or failure message is shown directly on the screen.
Note
The Enable webhook delivery checkbox is stored with the rest of the webhook configuration, but MT Showcase does not yet send events automatically. To move captured data into another system, use the CSV downloads described above.